Skogul Enrichment
Posted on 2022-05-09
We have been using and working on Skogul extensively for the last few years. The "killer feature" is probably support for Juniper telemetry, but for us, Skogul is much more than that.
You can use Skogul to receive time series data on a number of different formats and using a number of different protocols, and transform it, filter it and selectively redirect it, e.g., to permanent storage. For very simple statistics-gathering setups, it might not be needed - you can just use your data collector to store things directly. For more advanced setups, it's a big benefit.
Today, v0.15.2 is released, which, together with v0.15.0, brings enrichment of metadata to the table. The enrichment in the v0.15-series is still experimental, but I believe it's stable and works well, but the specific configuration details might change somewhat, as they are a bit cumbersome.
PS: Scroll to the bottom for configuration examples.
What is enrichment anyway?
TL;DR: Adding metadata to incoming time series data.
An example can be if you are using Skogul to receive Junos telemetry and you want to add a description field to the interfaces, which the telemetry doesn't contain. You can now achieve this by loading a database of your interfaces and description.
An other example can be adding a customer ID.
How does it work?
Skogul enrichment takes place in the enrichment Transformer, which is optional. All enrichment exists in a database that lives in memory. Why not make it on-demand, e.g.: Look things up in a database on demand? The main reason I want to avoid that is speed and simplicity. I did some minor tests, and the memory footprint is not significant, assuming the loading is sensible. E.g.: If you actually have 14 million interfaces, skogul will handle it fine, but it will need a few GB of memory.
I want Skogul to work regardless of scale.
One of the nicer things about the enrichment transformer, is that it comes paired with an enrichment sender. This sender can be used to update the enrichment database live, using any mechanism available to Skogul. E.g.: If Skogul can parse and receive data, it can use that to update the enrichment database - granted, many methods don't make sense. You can, in theory, use Juniper telemetry-data to update the enrichment, but that just doesn't make much sense imo.
Because I honestly was feeling lazy, I reused Skoguls definition of a Metric to define enrichment. The way this works is that whatever you specify in the Metadata section will be the look-up key, and whatever is specified in the data section will be added. Now the slightly confusing part is that data-section in the enrichment-data is added to metadata, and there is no way to directly add enrichment-data to the data-section of the "target data". If this is confusing, just bear with me until the examples at the end.
Limitations
- It lives in memory, and it's not on-demand. Preload or batch-load things.
- The configuration is a bit cumbersome.
- You can't add information to the data-section without using a secondary transformer to move it from metadata to data.
- The current version will block until the initial json is read - this is probably getting changed.
- There might not be a way to determine if the initial load is complete, and "un-enriched"-data might slip by without fancy tricks.
Some of these are acceptable trade-offs, some are more in the "we'll see how it works out before I decide if it's worth addressing".
Speed
Run-time speed is basically unaffected by enrichment. If skogul can handle your load without enrichment, adding enrichment does not slow it down. This is because the enrichment is done by just looking up a key in a map and adding it, which is lightning fast. I don't have bench-marks, but it's running fine on some of our more considerable skogul-instance.
The size of the enrichment database affects memory footprint. Currently, there is a flaw where the actual JSON encoding takes up a considerable amount of overhead, and I'm looking into this and hope to resolve it in the v0.15.x series.
The current bottle neck is actually initial loading, but again, you need a serious amount of data to notice. I do intend to use this for data sets with roughly 14 million entries at present time.
SHOW ME THE CONFIG
Sorry for the delay.
This is from tester_to_stdout_enrich.json:
{
  "receivers": {
    "test": {
      "type": "test",
      "handler": "json",
      "metrics": 3,
      "values": 2,
      "delay": "1s",
      "threads": 1
    },
    "updater": {
        "type": "http",
        "address": "[::1]:8080",
        "handlers": { "/": "update" }
    }
  },
  "handlers": {
    "json": {
      "parser": "json",
      "transformers": ["enrich"],
      "sender": "print"
    },
    "update": {
        "parser": "json",
        "sender": "updater"
    }
  },
  "transformers": {
          "enrich":  {
                  "type": "enrich",
                  "source": "docs/examples/payloads/enrich.json",
                  "keys": ["key1"]
          }
  },
  "senders": {
          "updater": {
                  "type": "enrichmentupdater",
                  "enricher": "enrich"
          }
  }
}
This sets up TWO receivers, the primary receiver is the test-receiver - replaces this with whatever you already have (e.g.: udp/protobuf), the second one, the "updater" is used to update the enrichment data live using HTTP on localhost.
The two handlers are similar. Note that I'm using the "print" sender for the regular data stream which just prints the data to stdout. Since it supports "automake" you don't have to explicitly define it.
The transformer named "enrich" is the one that does the actual enrichment. It has two configuration options, but one might disappear. One option is the list of keys to look up, the other is the source path.
The source past is a json file that is read at start-up, this option was added BEFORE the enrichment updater was written, and I will probably remove it since it is mostly redundant now. But for now, it can be used to set up the initial database.
The "updater" sender, of type "enrichmentupdater" (or just "eupdater") has a reference back to the transformer. I'm sorry for the somewhat confusing names, but you can have multiple independent enrichment transformers with unique names.
File format(s)
We re-use the Metric format. For a file on disk, use:
{
        "metadata": { "key1": 1 },
        "data": {
                "example": "hei"
        }
}
{
        "metadata": { "key1": 2 },
        "data": {
                "customer": "nei",
                "serial": 123123123
        }
}
{
        "metadata": { "key1": 0 },
        "data": {
                "potato": "tomato",
                "tree": {
                        "hi": "ho",
                        "lol": "kek"
                }
        }
}
Note: This is NOT an array. It's a stream. Also note: You probably should add a timestamp, even though it's not used. The reason? Because if you try to load that through the file receiver instead, it will fail to validate without SOME timestamp. Sorry for the inconsistency.
If you seek to update this live, you can use something like:
kly@thrawn:~/src/skogul$ cat foo.json
{
        "metrics": [
        {
                "timestamp": "2022-05-09T18:59:00Z",
                "metadata": { "key1": 0 },
                "data": {
                        "potato": "lumpe"
                }
        }
        ]
}
kly@thrawn:~/src/skogul$ POST -USse http://[::1]:8080/ < foo.json
POST http://[::1]:8080/
User-Agent: lwp-request/6.52 libwww-perl/6.52
Content-Length: 134
Content-Type: application/x-www-form-urlencoded

204 No Content
Connection: close
Date: Mon, 09 May 2022 18:02:46 GMT
Client-Date: Mon, 09 May 2022 18:02:46 GMT
Client-Peer: ::1:8080
Client-Response-Num: 1

kly@thrawn:~/src/skogul$
Here's a complete example:
kly@thrawn:~/src/skogul$ cat docs/examples/tester_to_stdout_enrich.json
{
  "receivers": {
    "test": {
      "type": "test",
      "handler": "json",
      "metrics": 3,
      "values": 2,
      "delay": "15s",
      "threads": 1
    },
    "updater": {
        "type": "http",
        "address": "[::1]:8080",
        "handlers": { "/": "update" }
    }
  },
  "handlers": {
    "json": {
      "parser": "json",
      "transformers": ["enrich"],
      "sender": "print"
    },
    "update": {
        "parser": "json",
        "sender": "updater"
    }
  },
  "transformers": {
          "enrich":  {
                  "type": "enrich",
                  "source": "docs/examples/payloads/enrich.json",
                  "keys": ["key1"]
          }
  },
  "senders": {
          "updater": {
                  "type": "enrichmentupdater",
                  "enricher": "enrich"
          }
  }
}
kly@thrawn:~/src/skogul$ cat docs/examples/payloads/enrich.json
        {
                "metadata": { "key1": 1 },
                "data": {
                        "example": "hei"
                }
        }
        {
                "metadata": { "key1": 2 },
                "data": {
                        "customer": "nei",
                        "serial": 123123123
                }
        }
        {
                "metadata": { "key1": 0 },
                "data": {
                        "potato": "tomato",
                        "tree": {
                                "hi": "ho",
                                "lol": "kek"
                        }
                }
        }
kly@thrawn:~/src/skogul$ ./skogul -f docs/examples/tester_to_stdout_enrich.json
WARN[0000] The enrichment transformer is in use. This transformer is highly experimental and not considered production ready. Functionality and configuration parameters will change as it matures. If you use this, PLEASE provide feedback on what your use cases require.  category=transformer transformer=enrich
{
  "metrics": [
    {
      "timestamp": "2022-05-09T20:04:14.938349097+02:00",
      "metadata": {
        "id": "test",
        "key1": 0,
        "potato": "tomato",
        "tree": {
          "hi": "ho",
          "lol": "kek"
        }
      },
      "data": {
        "metric0": 5577006791947779410,
        "metric1": 8674665223082153551
      }
    },
    {
      "timestamp": "2022-05-09T20:04:14.938349097+02:00",
      "metadata": {
        "example": "hei",
        "id": "test",
        "key1": 1
      },
      "data": {
        "metric0": 6129484611666145821,
        "metric1": 4037200794235010051
      }
    },
    {
      "timestamp": "2022-05-09T20:04:14.938349097+02:00",
      "metadata": {
        "customer": "nei",
        "id": "test",
        "key1": 2,
        "serial": 123123123
      },
      "data": {
        "metric0": 3916589616287113937,
        "metric1": 6334824724549167320
      }
    }
  ]
}
In a second terminal, updating the enrichment:
kly@thrawn:~/src/skogul$ cat foo.json
{
        "metrics": [
        {
                "timestamp": "2022-05-09T18:59:00Z",
                "metadata": { "key1": 0 },
                "data": {
                        "potato": "lumpe"
                }
        }
        ]
}
kly@thrawn:~/src/skogul$ POST -USse http://[::1]:8080/ < foo.json
POST http://[::1]:8080/
User-Agent: lwp-request/6.52 libwww-perl/6.52
Content-Length: 134
Content-Type: application/x-www-form-urlencoded

204 No Content
Connection: close
Date: Mon, 09 May 2022 18:04:22 GMT
Client-Date: Mon, 09 May 2022 18:04:22 GMT
Client-Peer: ::1:8080
Client-Response-Num: 1
Back in the first terminal with Skogul running:
WARN[0007] Hash collision while adding item &{2022-05-09 18:59:00 +0000 UTC map[key1:0] map[potato:lumpe]}! Overwriting!  category=transformer transformer=enrich
{
  "metrics": [
    {
      "timestamp": "2022-05-09T20:04:29.939744465+02:00",
      "metadata": {
        "id": "test",
        "key1": 0,
        "potato": "lumpe"
      },
      "data": {
        "metric0": 605394647632969758,
        "metric1": 1443635317331776148
      }
    },
    {
      "timestamp": "2022-05-09T20:04:29.939744465+02:00",
      "metadata": {
        "example": "hei",
        "id": "test",
        "key1": 1
      },
      "data": {
        "metric0": 894385949183117216,
        "metric1": 2775422040480279449
      }
    },
    {
      "timestamp": "2022-05-09T20:04:29.939744465+02:00",
      "metadata": {
        "customer": "nei",
        "id": "test",
        "key1": 2,
        "serial": 123123123
      },
      "data": {
        "metric0": 4751997750760398084,
        "metric1": 7504504064263669287
      }
    }
  ]
}
Notice how the "potato"-metadata field updated. You can ignore the warning, since we _know_ it was a "collision": We wanted to update existing data, and that warning is meant for initial loading mostly.
Future
I will be trying to put this blog-post into more proper documentation, add an SQL receiver, probably _remove_ the "source"-setting and instead provide good examples for common use cases. We have a bit too many examples right now.
Any feedback is more than welcome, preferably in the form of issues on github (questions or general discussion on issues are fine - there are not that many issues).
Particularly if you find this useful or if it doesn't solve your enrichment-related problems I'd love to hear from you.
Getting Junos Telemetry working using Skogul and InfluxDB
Posted on 2020-01-13
For the last year and a half, I've been working on improving the networking monitoring system here at Telenor Norge. With a network that consists of thousands of sites, that's a big topic to cover, but one of the more interesting bits we're doing is introducing Juniper's "streaming telemetry" as a replacement/supplement to SNMP.
This means that instead of having an SNMP poller, our routers will send the data directly to our collectors, as configured by the router.
This is still very new stuff and it can be a bit rough around the edges, but the core functionality works quite well. Juniper has chosen to implement this using Google Protocol Buffers, which I honestly don't think is a great idea for the industry as a whole, but it's not too bad either. It doesn't take much to out shine SNMP.
Since one of the first things we realized when designing a new monitoring system was that we wanted to decouple how we receive data from how we store it, I set about writing Skogul (https://github.com/telenornms/skogul), and it's Open Source. And it supports Junipers streaming telemetry out of the box.
Skogul is able to accept various types of data, parse it into a common internal format, and pass it on to a number of different places. In this blog post, I'll show you how you can configure your Juniper MX routers to send telemetry, set up Skogul to receive it, parse it and store it in InfluxDB.
What I will _not_ cover is how to set up InfluxDB. There are plenty of guides for that.
Step 1: Junos config
You need to configure three items, all in services analytics. This is an example config:
streaming-server telemetry_1 {
    remote-address 192.168.0.10;
    remote-port 3300;
}
streaming-server telemetry_2 {
    remote-address 192.168.0.20;
    remote-port 3300;
}
export-profile export_fast {
    reporting-rate 6;
    payload-size 3000;
    format gpb;
    transport udp;
}
export-profile export_medium {
    reporting-rate 30;
    payload-size 3000;
    format gpb;
    transport udp;
}
export-profile export_slow {
    reporting-rate 300;
    payload-size 3000;
    format gpb;
    transport udp;
}

sensor xx_linecard_intf-exp {
    server-name [ telemetry_1 telemetry_2 ];
    export-name export_medium;
    resource /junos/system/linecard/intf-exp/;
}
sensor xx_linecard_optics {
    server-name [ telemetry_1 telemetry_2 ];
    export-name export_slow;
    resource /junos/system/linecard/optics/;
}
sensor xx_interfaces_interface {
    server-name [ telemetry_1 telemetry_2 ];
    export-name export_fast;
    resource /junos/system/linecard/interface/;
}
sensor xx_interfaces_interface_subinterfaces {
    server-name [ telemetry_1 telemetry_2 ];
    export-name export_medium;
    resource /junos/system/linecard/interface/logical/usage/;
}
First, this sets up two different servers that will receive the telemetry stream. You don't need two, obviously, but redundancy is nice.
Second, the export profiles are defined. It's a good idea to differentiate between data. A few minor notes here: If you do not have jumbo frames all the way from your routers to your collectors, you need to set payload size. BUT, this number doesn't mean what you think it means. This is a value we've set to get the UDP packets to actually be <1500 bytes. How setting a value to 3000 results in a packet size of 1500? Well, let's just say we have an open dialog about this :)
Last, we set up four sensors. Both Skogul and Junos support more than this, but these are by far the most useful ones. I've prefixed each sensor with "xx", which is obviously optional. You can call them whatever.
The four sensors are:
- intf-exp, think operstatus.
- linecard/optics, optical power dampening data. You don't need this very frequently, so it's using a slow export profile.
- linecard/interface, this is traffic data and much more for physical interfaces. Think "ifTable", except it also includes queue stats and more.
- linecard/interface/logical/usage, very similar to linecard/interface, except for logical interfaces.
Check out Junipers own documentation for more details on other sensors.
Once you've configured this, you should verify that you are receiving data at the collector-side.
Step 2: Skogul basics
Grab the latest Skogul release from https://github.com/telenornms/skogul/releases and install it. The github page should have plenty of installation instructions. We provide pre-built binaries for Red Hat - including systemd units, and a generic 64bit build for Linux. If you need or want Debian packages, patches are more than welcome (or a github issue). In the meanwhile, you should be able to get it working using just the generic binary and the Systemd service file found in the repo.
Skogul comes with the Junos telemetry protocol buffers bundled, so you don't have to think about that at all (be thankful... long story).
Once you've installed it, you need a configuration. Skogul uses a single JSON file as configuration, and the configuration consists of several small modules. We are going to set up a single receiver - the UDP receiver. This will use a single handler to deal with data. In our case, the handler will use protobuf as a parser, a set of transformers to "flatten" the data structure, and a sender that consists of first a "duplicate", then both "debug" and "influxdb".
In reality, our production installation is slightly more complex. We receive the telemetry data from the network at one server, then re-send it as HTTP JSON data to an other server which stores it. But this is more complex than we need it to be for our example.
First, our working config, with 0 transformers and only debug:
{
  "receivers": {
      "udp": {
        "type": "udp",
        "address": ":3300",
        "handler": "protobuf"
      }
  },
  "handlers": {
    "protobuf": {
      "parser": "protobuf",
      "transformers": [],
      "sender": "print"
    }
  },
  "senders": {
    "print": {
        "type": "debug"
    }
  }
}
Using this configuration, Skogul should start printing JSON-formatted telemetry-data to stdout (so either run it on the command line, or look at the journal).
If this doesn't print anything sensible, something is wrong.
Step 3: Flattening
Skogul's implementation of Juniper's Streaming Telemetry is generic. It can parse anything that was part of the most recently imported Junos telemetry files.
But Skogul doesn't have a preference for storage engine. You can store the incoming data as JSON in a postgres database (we do this for debugging). Or you can store it in InfluxDB.
However, since the telemetry data is a nested data structure, we need to un-nest it. Instead of writing a set of hard-coded hacks to accomplish this, Skogul has a concept of "transformers". A transformer looks at the incoming data and, you guessed it, transforms it.
The simplest transformers can do stuff like add or remove key/value pairs. The ones that are more interesting for us will iterate over an array and split it into multiple metrics.
E.g.: Since a single telemetry packet can include data for numerous interfaces, we use a transformer to create unique metrics for each interface.
And we use transformer to change:
"ingress_stats": {
   "if_octets": 123
},
"egress_stats": {
   "if_octets": 123
}
Into:
"ingress_stats__if_octets": 123,
"egress_stats__if_octets": 123
This is all for the benefit of InfluxDB, which (reasonably enough) doesn't support nested data structures.
We also do a few minor tricks with transformers, such as move "if_name" from the data-field to metadata, turning it into a searchable tag in InfluxDB. Feel free to experiment with this.
You can write your own configuration for any data skogul can parse.
One last thing we do, which is critical for our convenience, is that we store the sensor-name as a metadata field. We then use this as the "measurement" to store data to in the InfluxDB sender. We need to do some regex-cleaning on it too, since influxdb isn't very fond of using "/junos/system/linecard/interface/" as a measurement name.
Re-using the previous configuration:
{
  "receivers": {
      "udp": {
        "type": "udp",
        "address": ":3300",
        "handler": "protobuf"
      }
  },
  "handlers": {
    "protobuf": {
      "parser": "protobuf",
      "transformers": [
          "interfaceexp_stats",
          "interface_stats",
          "interface_info",
          "optics_diag",
          "interfaces_interface",
          "flatten",
          "remove",
          "extract_names",
          "extract_measurement_name",
          "extract_measurement_name2",
          "flatten_systemId"
      ],
      "sender": "print"
    }
  },
  "senders": {
    "print": {
        "type": "debug"
    }
  },
  "transformers": {
     "interfaceexp_stats": {
        "type": "split",
        "field": ["interfaceExp_stats"]
     },
     "interfaces_interface": {
        "type": "split",
        "field": ["interface"]
     },
     "interface_stats": {
        "type": "split",
        "field": ["interface_stats"]
     },
     "interface_info": {
        "type": "split",
        "field": ["interface_info"]
     },
     "optics_diag": {
        "type": "split",
        "field": ["Optics_diag"]
     },
     "flatten": {
        "type": "data",
        "flatten": [
           ["aggregation","state"],
           ["egress_queue_info"],
           ["egress_errors"],
           ["egress_stats"],
           ["ingress_errors"],
           ["ingress_stats"],
           ["egress_stats"],
           ["ingress_stats"],
           ["op_state"],
           ["optics_diag_stats"],
           ["optics_diag_stats__optics_lane_diag_stats"]
        ]
     },
     "remove": {
        "type": "data",
        "remove": [
           "aggregation",
           "egress_queue_info",
           "egress_errors",
           "egress_stats",
           "ingress_errors",
           "ingress_stats",
           "egress_stats",
           "ingress_stats",
           "op_state",
           "optics_diag_stats",
           "optics_diag_stats__optics_lane_diag_stats"
        ]
     },
     "extract_names": {
        "type": "metadata",
        "extractFromData": ["if_name", "parent_ae_name","name"]
     },
     "extract_measurement_name": {
        "type": "replace",
        "regex": "^([^:]*):/([^:]*)/:.*$",
        "source": "sensorName",
        "destination": "measurement",
        "replacement": "$2"
     },
     "extract_measurement_name2": {
        "type": "replace",
        "regex": "[^a-zA-Z]",
        "source": "measurement",
        "replacement": "_"
     },
     "flatten_systemId": {
        "type": "replace",
        "regex": "-.*$",
        "source": "systemId"
     }
  }
}
This exact configuration should work, and still print JSON data, but now you will have "flat" json-data.
Arguably all these transformers make the configuration a bit extensive, and since this is NOT a "clean" config, but the result of what we actually have working after experimentation and simultaneously developing the necessary tranformers. We wanted the transformers to be completely generic, which makes for a very powerful tool, if somewhat extensive configuration.
We'll likely add a "library" or similar to skogul, where we can ship configuration such as this and you can just include it. But for now, you'll just have to copy/paste it.
Also, this isn't optimal CPU-wise - it will attempt all transformations for all sensors. But it's fast enough that it doesn't matter that much. We've written a new transformer to address this, but haven't configured it yet.
If you are not seeing valid JSON data that looks "flat" (e.g.: no arrays or nested objects in the "data" and "metadata" structures), then you need to review the previous steps (or nag me if I made a typo).
Step 4: Writing to influxdb
You've already got InfluxDB up (if not duckduckgo-it). So just add an InfluxDB sender. The sender itself looks like:
"influx": {
  "type": "influx",
  "measurementfrommetadata": "measurement",
  "URL": "https://your-influx-host:andport/write?db=db",
  "Timeout": "4s"
}
The only thing interesting here is "measurementfrommetadata", which tells the influx-sender to chose which measurement to write to based on a metadata key. This is how we end up with different measurements for different sensors.
All put together:
{
  "receivers": {
      "udp": {
        "type": "udp",
        "address": ":3300",
        "handler": "protobuf"
      }
  },
  "handlers": {
    "protobuf": {
      "parser": "protobuf",
      "transformers": [
          "interfaceexp_stats",
          "interface_stats",
          "interface_info",
          "optics_diag",
          "interfaces_interface",
          "flatten",
          "remove",
          "extract_names",
          "extract_measurement_name",
          "extract_measurement_name2",
          "flatten_systemId"
      ],
      "sender": "fallback"
    }
  },
  "senders": {
     "fallback": {
        "type": "fallback",
        "next": ["influx","print"]
     },
     "print": {
        "type": "debug"
     },
     "influx": {
        "type": "influx",
        "measurementfrommetadata": "measurement",
        "URL": "https://your-influx-host:andport/write?db=db",
        "Timeout": "4s"
     }
  },
  "transformers": {
     "interfaceexp_stats": {
        "type": "split",
        "field": ["interfaceExp_stats"]
     },
     "interfaces_interface": {
        "type": "split",
        "field": ["interface"]
     },
     "interface_stats": {
        "type": "split",
        "field": ["interface_stats"]
     },
     "interface_info": {
        "type": "split",
        "field": ["interface_info"]
     },
     "optics_diag": {
        "type": "split",
        "field": ["Optics_diag"]
     },
     "flatten": {
        "type": "data",
        "flatten": [
           ["aggregation","state"],
           ["egress_queue_info"],
           ["egress_errors"],
           ["egress_stats"],
           ["ingress_errors"],
           ["ingress_stats"],
           ["egress_stats"],
           ["ingress_stats"],
           ["op_state"],
           ["optics_diag_stats"],
           ["optics_diag_stats__optics_lane_diag_stats"]
        ]
     },
     "remove": {
        "type": "data",
        "remove": [
           "aggregation",
           "egress_queue_info",
           "egress_errors",
           "egress_stats",
           "ingress_errors",
           "ingress_stats",
           "egress_stats",
           "ingress_stats",
           "op_state",
           "optics_diag_stats",
           "optics_diag_stats__optics_lane_diag_stats"
        ]
     },
     "extract_names": {
        "type": "metadata",
        "extractFromData": ["if_name", "parent_ae_name","name"]
     },
     "extract_measurement_name": {
        "type": "replace",
        "regex": "^([^:]*):/([^:]*)/:.*$",
        "source": "sensorName",
        "destination": "measurement",
        "replacement": "$2"
     },
     "extract_measurement_name2": {
        "type": "replace",
        "regex": "[^a-zA-Z]",
        "source": "measurement",
        "replacement": "_"
     },
     "flatten_systemId": {
        "type": "replace",
        "regex": "-.*$",
        "source": "systemId"
     }
  }
}
I added one last bit: The fallback sender. With that Skogul will first try the influxdb sender, if that fails, it will use the next one up: printing to stdout. So if you see lots of data on stdout, something is wrong.
Bonus: Continuous Queries for InfluxDB
If you have an extensive network, you probably want some continuous queries up. We're currently working on these, but this is a good start, and avoids a few nasty pitfalls:
name: skogul
name        query
----        -----
cq_if_stats CREATE CONTINUOUS QUERY cq_if_stats ON skogul RESAMPLE FOR 7m BEGIN SELECT mean(inoctets) AS inoctets, mean(outoctets) AS outoctets, max(*), min(*) INTO skogul.autogen.interface_rates FROM (SELECT non_negative_derivative(ingress_stats__if_octets, 1s) AS inoctets, non_negative_derivative(egress_stats__if_octets, 1s) AS outoctets FROM skogul.autogen.junos_system_linecard_interface GROUP BY systemId, if_name, parent_ae_name) GROUP BY *, time(1m) fill(linear) END
ae_rates    CREATE CONTINUOUS QUERY ae_rates ON skogul RESAMPLE FOR 7m BEGIN SELECT sum(inoctets) AS inoctets, sum(outoctets) AS outoctets, sum(max_inoctets) AS max_inoctets, sum(max_outoctets) AS max_outoctets, sum(min_inoctets) AS min_inoctets, sum(min_outoctets) AS min_outoctets INTO skogul.autogen.ae_rates FROM (SELECT mean(inoctets) AS inoctets, mean(outoctets) AS outoctets, max(max_inoctets) AS max_inoctets, max(max_outoctets) AS max_outoctets, min(min_inoctets) AS min_inoctets, min(min_outoctets) AS min_outoctets FROM skogul.autogen.interface_rates WHERE parent_ae_name =~ /ae.*/ GROUP BY systemId, if_name, parent_ae_name, time(1m) fill(linear)) GROUP BY systemId, parent_ae_name, time(1m) END
Granted, you don't really need the mean/max/min stuff if you're doing time(1m), but these CQs will work for other time periods too.
They also cover a rather annoying shortcoming if influxdb: You can't really delay a CQ. So if it's group by time(1m), then they will run ON the minute, every minute. That means data arriving at or around the exact minute might not arrive in time. We compensate for this with "resample for 7m". In addition, these queries use a _linear_ fill. But because they only ever evaluate 7 minutes of data, you will still get holes in your graphs if you do not get sensor data for more than 5-6 minutes.
I could write lots more about this, but this should get you started.
Bonus: Grafana dashboard
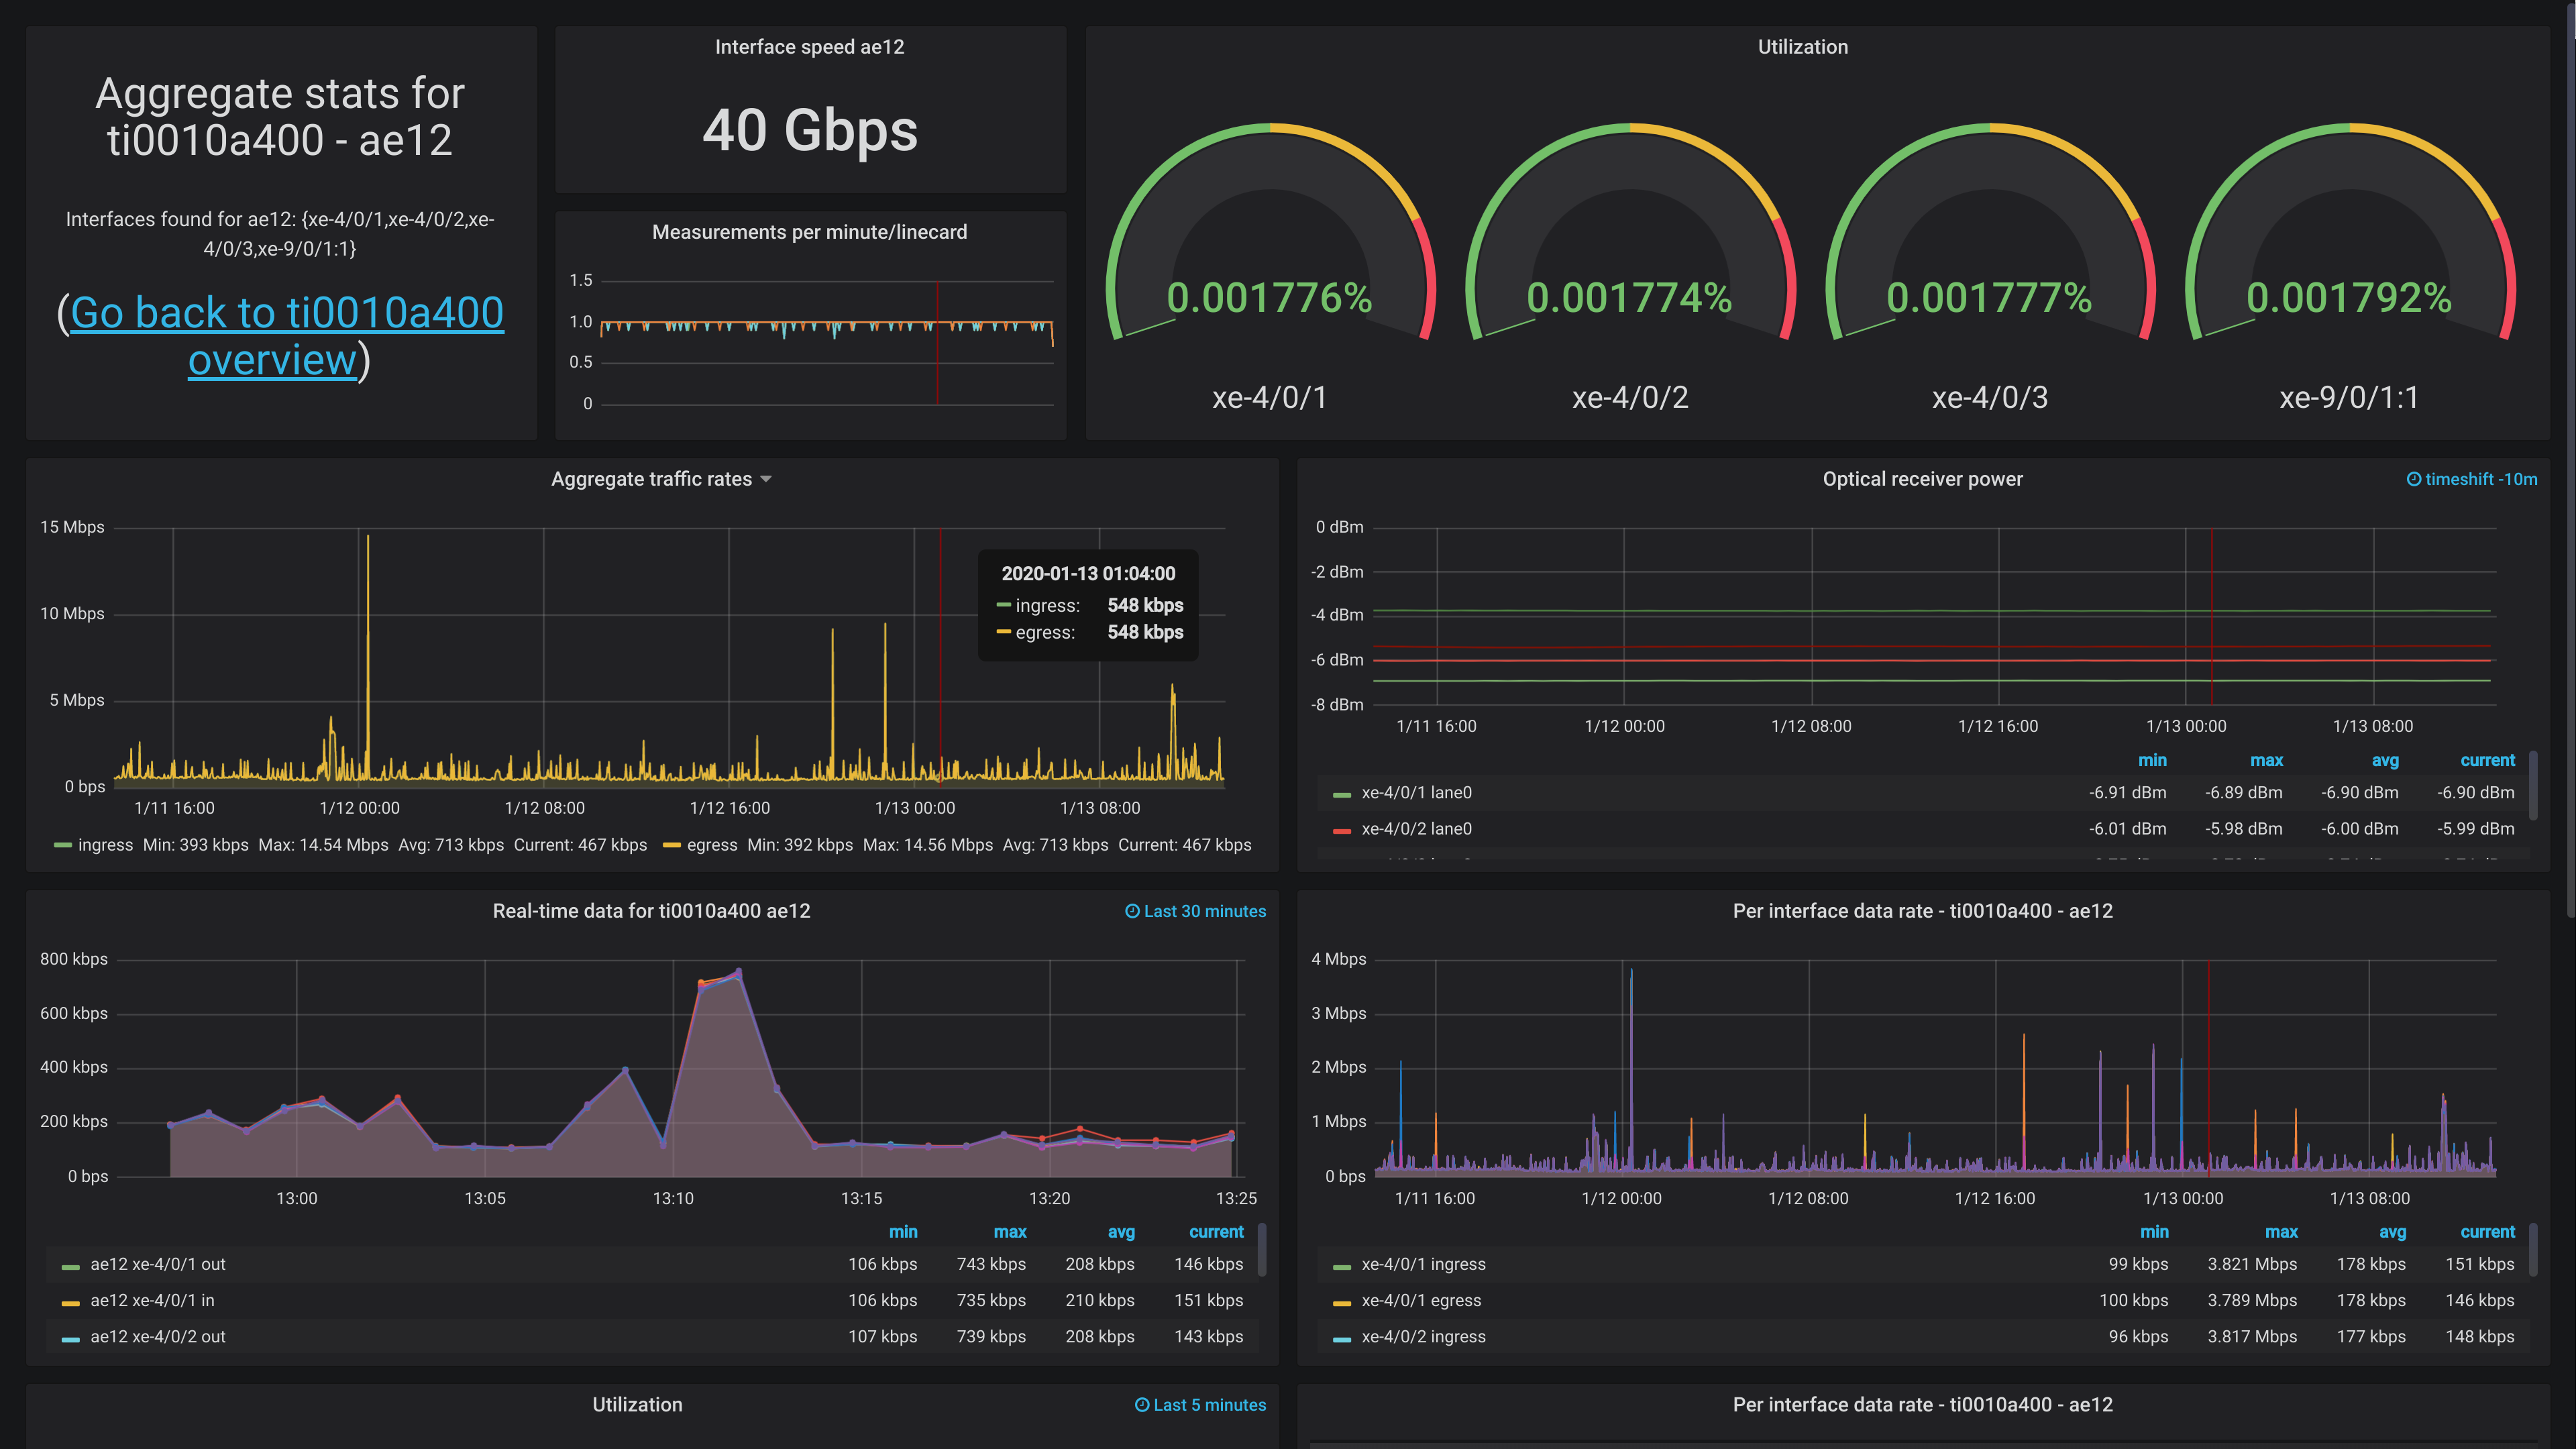
There's a ton of stuff you can do with this data. Unfortunately, I don't have a lot of devices I can readily show off at present - they would be showing data we can't share.
I plan on doing a more extensive write-up of how we address Grafana as a whole later, since it's a surprisingly large topic.
However, I can share a screenshot of one dashboard, showing off the aggregate uplink for The Gathering (www.gathering.org). It doesn't have any actual traffic now, since the event isn't until easter, but it should at least.
Feedback
Feel free to give feedback on twitter (http://twitter.com/KristianLyng) or wherever you can find me.
Varnish Foo - Chapter 3
Posted on 2015-12-20
I have just pushed the third chapter of Varnish Foo online. Unlike the first two chapters, I will not post the entire chapter here on my blog.
Instead, you can head over to the official location to read it:
https://varnishfoo.info/chapter-3.html
There you will also find the first two chapters and the appendices, along with a PDF version.
I still expect changes to the chapter, but the content is largely complete and ready to be consumed. The front page of https://varnishfoo.info has instructions for how to best give feedback. I've already started getting some, and hope to get more as time passes.
Varnish Foo - Working With HTTP caching
Posted on 2015-12-02
Note
This is the second chapter of Varnish Foo, the book I'm writing on Varnish cache. You can find the source code at https://github.com/KristianLyng/varnishfoo . Feedback welcome.
Before you dig into the inner workings of Varnish, it's important to make sure you have the tools you need and some background information on basic caching.
This chapter looks at how HTTP caching works on multiple points in the delivery chain, and how these mechanisms work together. Not every aspect of HTTP caching is covered, but those relevant to Varnish are covered in detail. Including several browser-related concerns.
There are a multitude of tools to chose from when you are working with Varnish. This chapter provides a few suggestions and a quick guide to each tool, but makes no claim on whether one tool is better than the other. The goal is to establish what sort of tasks your chosen tool needs to be able to accomplish.
Only the absolute minimum of actual Varnish configuration is covered - yet several mechanisms to control Varnish through backend responses are provided. Most of these mechanisms are well defined in the HTTP 1.1 standard, as defined in RFC2616.
Tools: The browser
A browser is an important tool. Most of todays web traffic is, unsurprisingly, through a web browser. Therefor, it is important to be able to dig deeper into how they work with regards to cache. Most browsers have a developer- or debug console, but we will focus on Chrome.
Both Firefox and Chrome will open the debug console if you hit <F12>. It's a good habit to test and experiment with more than one browser, and luckily these consoles are very similar. A strong case in favor of Chrome is Incognito Mode, activated through <Ctrl>+<Shift>+N. This is an advantage both because it removes old cookies and because most extensions are disabled. Most examples use Chrome to keep things consistent and simple, but could just as well have been performed on Firefox.
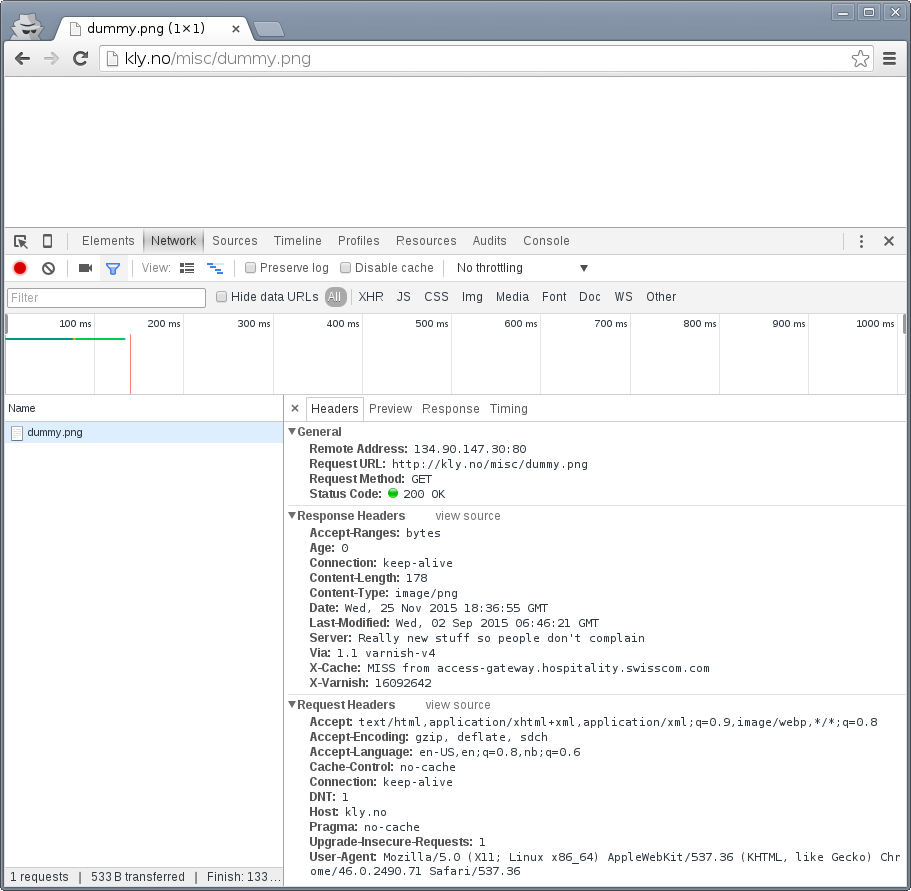
The importance of Incognito Mode can be easily demonstrated. The following is a test with a typical Chrome session:
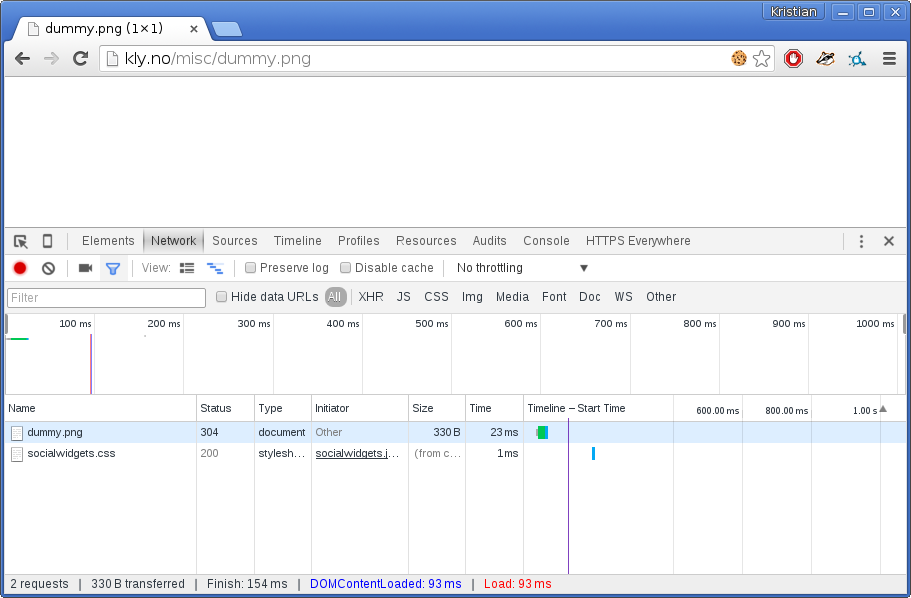
Notice the multiple extensions that are active, one of them is inserting a bogus call to socialwidgets.css. The exact same test in Incognito Mode:
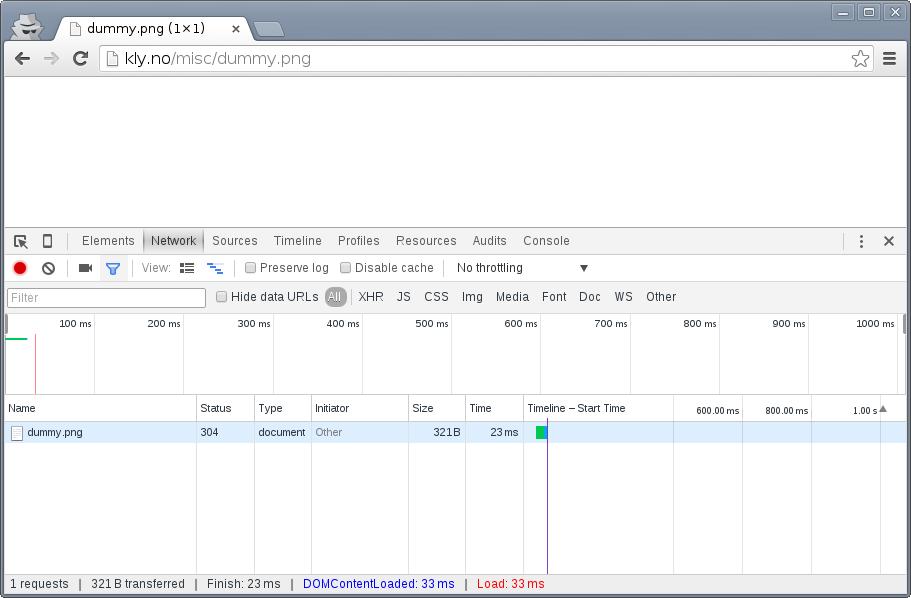
The extra request is gone. Regardless of browser choice, your test environment should be devoid of most extensions and let you easily get rid of all cookies.
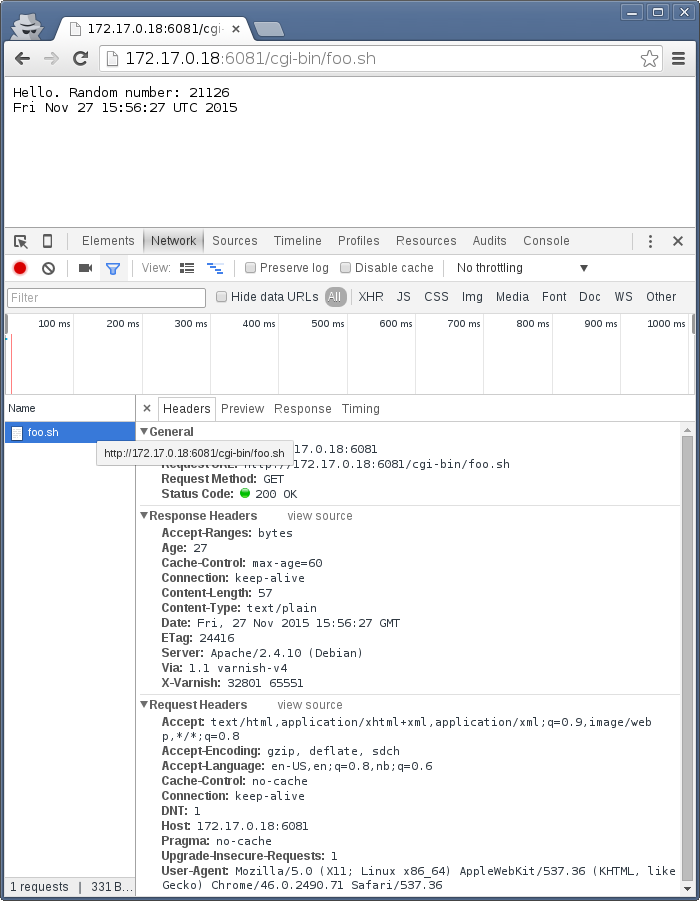
You will also quickly learn that a refresh isn't always just a refresh. In both Firefox and Chrome, a refresh triggered by <F5> or <Ctrl>+r will be "cache aware". What does that mean?
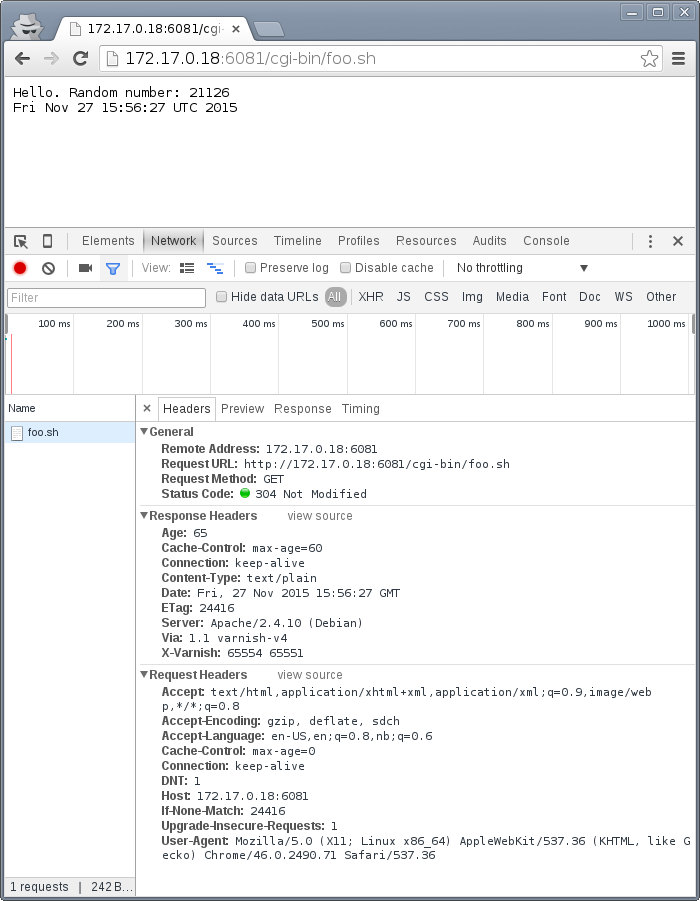
Look closer on the screenshots above, specially the return code. The return code is a 304 Not Modified, not a 200 OK. The browser had the image in cache already and issued a conditional GET request. A closer inspection:
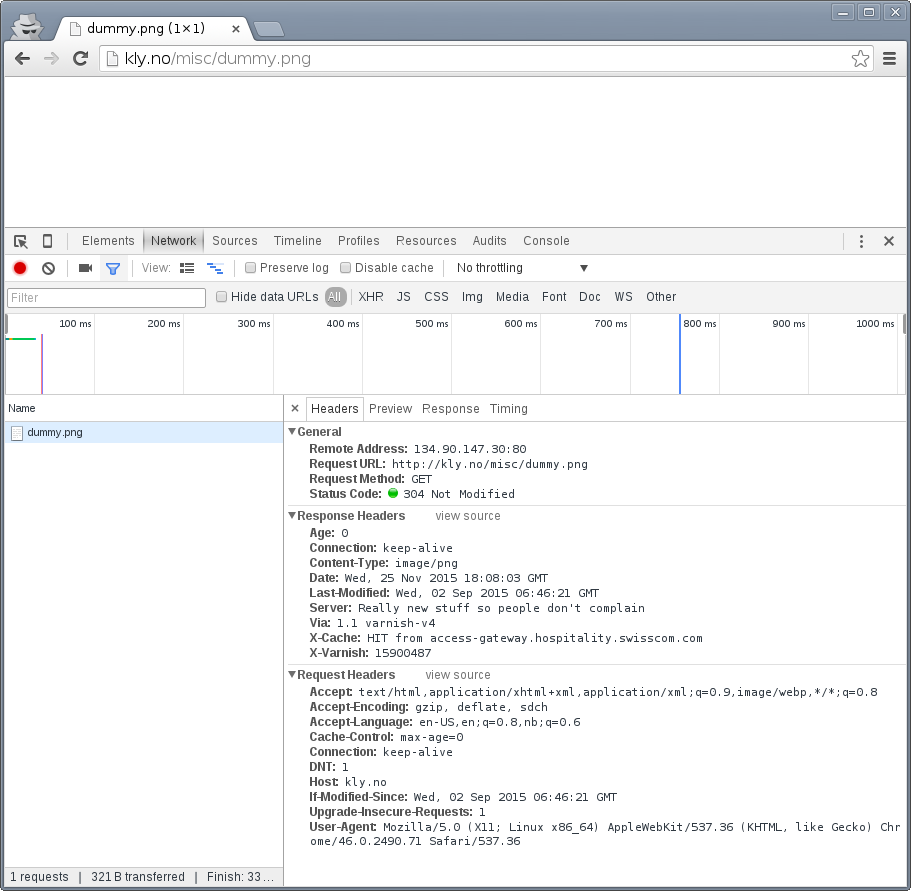
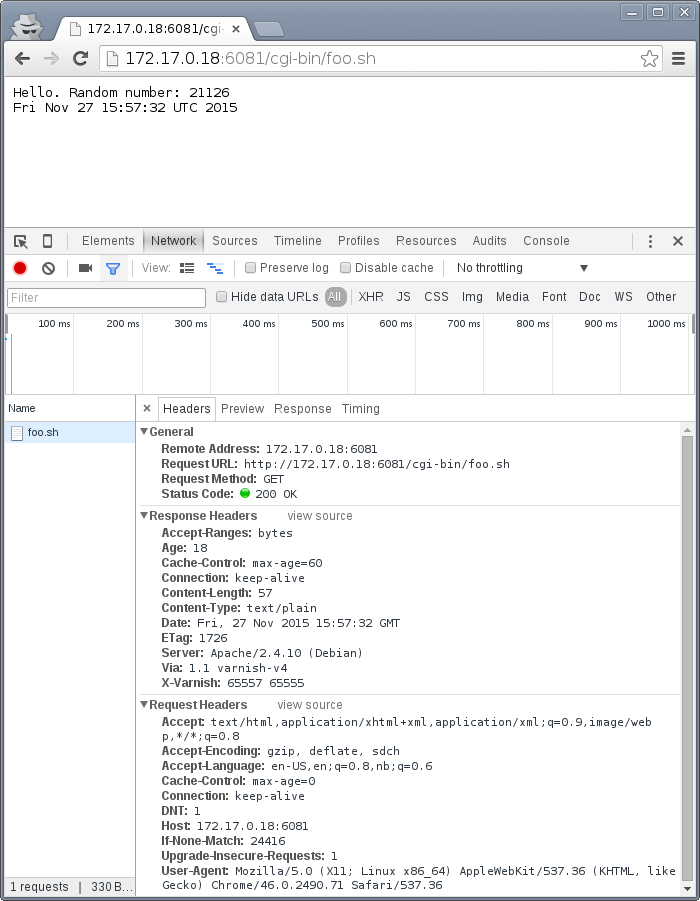
The browser sends Cache-Control: max-age=0 and an If-Modified-Since-header. The web server correctly responds with 304 Not Modified. We'll look closer at those, but for now, let's use a different type of refresh: <Shift>+<F5> in Chrome or <Shift>+<Ctrl>+r in Firefox:
The cache-related headers have changed somewhat, and the browser is no longer sending a If-Modified-Since header. The result is a 200 OK with response body instead of an empty 304 Not Modified.
These details are both the reason you need to test with a browser - because this is how they operate - and why a simpler tool is needed in addition to the browser.
Tools: The command line tool
The browser does a lot more than issue HTTP requests, specially with regards to cache. A good request synthesizer is a must to debug and experiment with HTTP and HTTP caching without stumbling over the browser. There are countless alternatives available.
Your requirement for a simple HTTP request synthesizer should be:
- Complete control over request headers and request method - even invalid input.
- Stateless behavior - no caching at all
- Show complete response headers.
Some suggestions for Windows users are curl in Powershell, Charles Web Debugging Proxy, the "Test and Rest Client" in PhpStorm, an "Adanced RST client" Chrome extension, or simply SSH'ing to a GNU/Linux VM and using one of the many tools available there. The list goes on, and so it could for Mac OS X and Linux too.
HTTPie is a small CLI tool which has the above properties. It's used throughout this book because it is a good tool, but also because it's easy to see what's going on without knowledge of the tool.
HTTPie is available on Linux, Mac OS X and Windows. On a Debian or Ubuntu system HTTPie can be installed with apt-get install httpie. For other platforms, see http://httpie.org. Testing httpie is simple:
$ http http://kly.no/misc/dummy.png
HTTP/1.1 200 OK
Accept-Ranges: bytes
Age: 0
Connection: keep-alive
Content-Length: 178
Content-Type: image/png
Date: Wed, 25 Nov 2015 18:49:33 GMT
Last-Modified: Wed, 02 Sep 2015 06:46:21 GMT
Server: Really new stuff so people don't complain
Via: 1.1 varnish-v4
X-Cache: MISS from access-gateway.hospitality.swisscom.com
X-Varnish: 15849590


+-----------------------------------------+
| NOTE: binary data not shown in terminal |
+-----------------------------------------+
In many situations, the actual data is often not that interesting, while a full set of request headers are very interesting. HTTPie can show us exactly what we want:
$ http -p Hh http://kly.no/misc/dummy.png
GET /misc/dummy.png HTTP/1.1
Accept: */*
Accept-Encoding: gzip, deflate
Connection: keep-alive
Host: kly.no
User-Agent: HTTPie/0.8.0

HTTP/1.1 200 OK
Accept-Ranges: bytes
Age: 81
Connection: keep-alive
Content-Length: 178
Content-Type: image/png
Date: Wed, 25 Nov 2015 18:49:33 GMT
Last-Modified: Wed, 02 Sep 2015 06:46:21 GMT
Server: Really new stuff so people don't complain
Via: 1.1 varnish-v4
X-Cache: HIT from access-gateway.hospitality.swisscom.com
X-Varnish: 15849590
The -p option to http can be used to control output. Specifically:
- -p H will print request headers.
- -p h will print response headers.
- -p B will print request body.
- -p b will print response body.
These can combined. In the above example -p H and -p h combine to form -p Hh. See http --help and man http for details. Be aware that there has been some mismatch between actual command line arguments and what the documentation claims in the past, this depends on the version of HTTPie.
The example shows the original request headers and full response headers.
Faking a Host-header is frequently necessary to avoid changing DNS just to test a Varnish setup. A decent request synthesizer like HTTPie does this:
$ http -p Hh http://kly.no/ "Host: example.com"
GET / HTTP/1.1
Accept: */*
Accept-Encoding: gzip, deflate
Connection: keep-alive
Host:  example.com
User-Agent: HTTPie/0.8.0

HTTP/1.1 200 OK
Accept-Ranges: bytes
Age: 0
Connection: keep-alive
Content-Encoding: gzip
Content-Type: text/html
Date: Wed, 25 Nov 2015 18:58:10 GMT
Last-Modified: Tue, 24 Nov 2015 20:51:14 GMT
Server: Really new stuff so people don't complain
Transfer-Encoding: chunked
Via: 1.1 varnish-v4
X-Cache: MISS from access-gateway.hospitality.swisscom.com
X-Varnish: 15577233
Adding other headers is done the same way:
$ http -p Hh http://kly.no/ "If-Modified-Since: Tue, 24 Nov 2015 20:51:14 GMT"
GET / HTTP/1.1
Accept: */*
Accept-Encoding: gzip, deflate
Connection: keep-alive
Host: kly.no
If-Modified-Since:  Tue, 24 Nov 2015 20:51:14 GMT
User-Agent: HTTPie/0.8.0

HTTP/1.1 304 Not Modified
Age: 5
Connection: keep-alive
Content-Encoding: gzip
Content-Type: text/html
Date: Wed, 25 Nov 2015 18:59:28 GMT
Last-Modified: Tue, 24 Nov 2015 20:51:14 GMT
Server: Really new stuff so people don't complain
Via: 1.1 varnish-v4
X-Cache: MISS from access-gateway.hospitality.swisscom.com
X-Varnish: 15880392 15904200
We just simulated what our browser did, and verified that it really was the If-Modified-Since header that made the difference earlier. To have multiple headers, just list them one after an other:
$ http -p Hh http://kly.no/ "Host: example.com" "User-Agent: foo" "X-demo: bar"
GET / HTTP/1.1
Accept: */*
Accept-Encoding: gzip, deflate
Connection: keep-alive
Host:  example.com
User-Agent:  foo
X-demo:  bar

HTTP/1.1 200 OK
Accept-Ranges: bytes
Age: 10
Connection: keep-alive
Content-Encoding: gzip
Content-Length: 24681
Content-Type: text/html
Date: Wed, 25 Nov 2015 19:01:08 GMT
Last-Modified: Tue, 24 Nov 2015 20:51:14 GMT
Server: Really new stuff so people don't complain
Via: 1.1 varnish-v4
X-Cache: MISS from access-gateway.hospitality.swisscom.com
X-Varnish: 15759349 15809060
Tools: A web server
Regardless of what web server is picked as an example in this book, it's the wrong one. So the first on an alphabetical list was chosen: Apache.
Any decent web server will do what you need. What you want is a web server where you can easily modify response headers. If you are comfortable doing that with NodeJS or some other slightly more modern tool than Apache, then go ahead. If you really don't care and just want a test environment, then keep reading. To save some time, these examples are oriented around Debian and/or Ubuntu-systems, but largely apply to any modern GNU/Linux distribution (and other UNIX-like systems).
Note that commands that start with # are executed as root, while commands starting with $ can be run as a regular user. This means you either have to login as root directly, through su - or sudo -i, or prefix the command with sudo if you've set up sudo on your system.
The first step is getting it installed and configured:
# apt-get install apache2
(...)
# a2enmod cgi
# cd /etc/apache2
# sed -i 's/80/8080/g' ports.conf sites-enabled/000-default.conf
# service apache2 restart
This installs Apache httpd, enables the CGI module, changes the listening port from port 80 to 8080, then restarts the web server. The listening port is changed because eventually Varnish will take up residence on port 80.
You can verify that it works through two means:
# netstat -nlpt
Active Internet connections (only servers)
Proto Recv-Q Send-Q Local Address           Foreign Address         State PID/Program name
tcp6       0      0 :::8080                 :::*                    LISTEN 1101/apache2
# http -p Hh http://localhost:8080/
GET / HTTP/1.1
Accept: */*
Accept-Encoding: gzip, deflate
Connection: keep-alive
Host: localhost:8080
User-Agent: HTTPie/0.8.0

HTTP/1.1 200 OK
Accept-Ranges: bytes
Connection: Keep-Alive
Content-Encoding: gzip
Content-Length: 3078
Content-Type: text/html
Date: Wed, 25 Nov 2015 20:23:09 GMT
ETag: "2b60-525632b42b90d-gzip"
Keep-Alive: timeout=5, max=100
Last-Modified: Wed, 25 Nov 2015 20:19:01 GMT
Server: Apache/2.4.10 (Debian)
Vary: Accept-Encoding
netstat reveals that apache2 is listening on port 8080. The second command issues an actual request. Both are useful to ensure the correct service is answering.
To provide a platform for experimenting with response header, it's time to drop in a CGI script:
# cd /usr/lib/cgi-bin
# cat > foo.sh <<_EOF_
 #!/bin/bash
 echo "Content-type: text/plain"
 echo
 echo "Hello. Random number: ${RANDOM}"
 date
 _EOF_
# chmod a+x foo.sh
# ./foo.sh
Content-type: text/plain

Hello. Random number: 12111
Wed Nov 25 20:26:59 UTC 2015
You may want to use an editor, like nano, vim or emacs instead of using cat. To clarify, the exact content of foo.sh is:
#!/bin/bash
echo "Content-type: text/plain"
echo
echo "Hello. Random number: ${RANDOM}"
date
We then change permissions for foo.sh, making it executable by all users, then verify that it does what it's supposed to. If everything is set up correctly, scripts under /usr/lib/cgi-bin are accessible through http://localhost:8080/cgi-bin/:
# http -p Hhb http://localhost:8080/cgi-bin/foo.sh
GET /cgi-bin/foo.sh HTTP/1.1
Accept: */*
Accept-Encoding: gzip, deflate
Connection: keep-alive
Host: localhost:8080
User-Agent: HTTPie/0.8.0

HTTP/1.1 200 OK
Connection: Keep-Alive
Content-Length: 57
Content-Type: text/plain
Date: Wed, 25 Nov 2015 20:31:00 GMT
Keep-Alive: timeout=5, max=100
Server: Apache/2.4.10 (Debian)

Hello. Random number: 12126
Wed Nov 25 20:31:00 UTC 2015
If you've been able to reproduce the above example, you're ready to start start testing and experimenting.
Tools: Varnish
We need an intermediary cache, and what better example than Varnish? We'll refrain from configuring Varnish beyond the defaults for now, though.
For now, let's just install Varnish. This assumes you're using a Debian or Ubuntu-system and that you have a web server listening on port 8080, as Varnish uses a web server on port 8080 by default:
# apt-get install varnish
# service varnish start
# http -p Hhb http://localhost:6081/cgi-bin/foo.sh
GET /cgi-bin/foo.sh HTTP/1.1
Accept: */*
Accept-Encoding: gzip, deflate
Connection: keep-alive
Host: localhost:6081
User-Agent: HTTPie/0.8.0

HTTP/1.1 200 OK
Accept-Ranges: bytes
Age: 0
Connection: keep-alive
Content-Length: 57
Content-Type: text/plain
Date: Wed, 25 Nov 2015 20:38:09 GMT
Server: Apache/2.4.10 (Debian)
Via: 1.1 varnish-v4
X-Varnish: 5

Hello. Random number: 26
Wed Nov 25 20:38:09 UTC 2015
As you can see from the above example, a typical Varnish installation listens to port 6081 by default, and uses 127.0.0.1:8080 as the backend web server. If the above example doesn't work, you can change the listening port of Varnish by altering the -a argument in /etc/default/varnish and issuing service varnish restart, and the backend web server can be changed in /etc/varnish/default.vcl, then issue a restart with service varnish restart. We'll cover both of these files in detail in later chapters.
Conditional GET requests
In the tool-examples earlier we saw real examples of a conditional GET requests. In many ways, they are quite simple mechanisms to allow a HTTP client - typically a browser - to verify that they have the most up-to-date version of the HTTP object. There are two different types of conditional GET requests: If-Modified-Since and If-None-Match.
If a server sends a Last-Modified-header, the client can issue a If-Modified-Since header on later requests for the same content, indicating that the server only needs to transmit the response body if it's been updated.
Some times it isn't trivial to know the modification time, but you might be able to uniquely identify the content anyway. For that matter, the content might have been changed back to a previous state. This is where the entity tag, or ETag response header is useful.
An Etag header can be used to provide an arbitrary ID to an HTTP response, and the client can then re-use that in a If-None-Match request header.
Modifying /usr/lib/cgi-bin/foo.sh, we can make it provide a static ETag header:
#!/bin/bash
echo "Content-type: text/plain"
echo "Etag: testofetagnumber1"
echo
echo "Hello. Random number: ${RANDOM}"
date
Let's see what happens when we talk directly to Apache:
# http http://localhost:8080/cgi-bin/foo.sh
HTTP/1.1 200 OK
Connection: Keep-Alive
Content-Length: 57
Content-Type: text/plain
Date: Wed, 25 Nov 2015 20:43:25 GMT
Etag: testofetagnumber1
Keep-Alive: timeout=5, max=100
Server: Apache/2.4.10 (Debian)

Hello. Random number: 51126
Wed Nov 25 20:43:25 UTC 2015

# http http://localhost:8080/cgi-bin/foo.sh
HTTP/1.1 200 OK
Connection: Keep-Alive
Content-Length: 57
Content-Type: text/plain
Date: Wed, 25 Nov 2015 20:43:28 GMT
Etag: testofetagnumber1
Keep-Alive: timeout=5, max=100
Server: Apache/2.4.10 (Debian)

Hello. Random number: 12112
Wed Nov 25 20:43:28 UTC 2015
Two successive requests yielded updated content, but with the same Etag. Now let's see how Varnish handles this:
# http http://localhost:6081/cgi-bin/foo.sh
HTTP/1.1 200 OK
Accept-Ranges: bytes
Age: 0
Connection: keep-alive
Content-Length: 57
Content-Type: text/plain
Date: Wed, 25 Nov 2015 20:44:53 GMT
Etag: testofetagnumber1
Server: Apache/2.4.10 (Debian)
Via: 1.1 varnish-v4
X-Varnish: 32770

Hello. Random number: 5213
Wed Nov 25 20:44:53 UTC 2015

# http http://localhost:6081/cgi-bin/foo.sh
HTTP/1.1 200 OK
Accept-Ranges: bytes
Age: 2
Connection: keep-alive
Content-Length: 57
Content-Type: text/plain
Date: Wed, 25 Nov 2015 20:44:53 GMT
Etag: testofetagnumber1
Server: Apache/2.4.10 (Debian)
Via: 1.1 varnish-v4
X-Varnish: 32773 32771

Hello. Random number: 5213
Wed Nov 25 20:44:53 UTC 2015
It's pretty easy to see the difference in the output. However, there are two things happening here of interest. First, Etag doesn't matter for this test because we never send If-None-Match! So our http-command gets a 200 OK, not the 304 Not Modified that we were looking for. Let's try that again:
# http http://localhost:6081/cgi-bin/foo.sh "If-None-Match:
testofetagnumber1"
HTTP/1.1 304 Not Modified
Age: 0
Connection: keep-alive
Content-Type: text/plain
Date: Wed, 25 Nov 2015 20:48:52 GMT
Etag: testofetagnumber1
Server: Apache/2.4.10 (Debian)
Via: 1.1 varnish-v4
X-Varnish: 8
Now we see Etag and If-None-Match at work. Also note the absence of a body: we just saved bandwidth.
Let's try to change our If-None-Match header a bit:
# http http://localhost:6081/cgi-bin/foo.sh "If-None-Match: testofetagnumber2"
HTTP/1.1 200 OK
Accept-Ranges: bytes
Age: 0
Connection: keep-alive
Content-Length: 57
Content-Type: text/plain
Date: Wed, 25 Nov 2015 20:51:10 GMT
Etag: testofetagnumber1
Server: Apache/2.4.10 (Debian)
Via: 1.1 varnish-v4
X-Varnish: 11

Hello. Random number: 12942
Wed Nov 25 20:51:10 UTC 2015
Content!
To summarize:
| Server | Client | Server |
|---|---|---|
| Last-Modified | If-Modified-Since | 200 OK with full response body, or 304 Not Modified with no response body. |
| ETag | If-None-Match |
Warning
The examples above also demonstrates that supplying static Etag headers or bogus Last-Modified headers can have unexpected side effects. foo.sh provides new content every time. Talking directly to the web server resulted in the desired behavior of the client getting the updated content, but only because the web server ignored the conditional part of the request.
The danger is not necessarily Varnish, but proxy servers outside of the control of the web site, sitting between the client and the web server. Even if a web server ignores If-None-Match and If-Modified-Since headers, there is no guarantee that other proxies do! Make sure to only provide Etag and Last-Modified-headers that are correct, or don't provide them at all.
Cache control, age and grace
An HTTP object has an age. This is how long it is since the object was fetched or validated from the origin source. In most cases, an object starts acquiring age once it leaves a web server.
Age is measured in seconds. The HTTP response header Age is used to forward the information regarding age to HTTP clients. You can specify maximum age allowed both from a client and server. The most interesting aspect of this is the HTTP header Cache-Control. This is both a response- and request-header, which means that both clients and servers can emit this header.
The Age header has a single value: the age of the object measured in seconds. The Cache-Control header, on the other hand, has a multitude of variables and options. We'll begin with the simplest: max-age=. This is a variable that can be used both in a request-header and response-header, but is most useful in the response header. Most web servers and many intermediary caches (including Varnish), ignores a max-age field received in a HTTP request-header.
Setting max-age=0 effectively disables caching, assuming the cache obeys:
# http http://localhost:6081/cgi-bin/foo.sh
HTTP/1.1 200 OK
Accept-Ranges: bytes
Age: 0
Cache-Control: max-age=0
Connection: keep-alive
Content-Length: 57
Content-Type: text/plain
Date: Fri, 27 Nov 2015 15:41:53 GMT
Server: Apache/2.4.10 (Debian)
Via: 1.1 varnish-v4
X-Varnish: 32776

Hello. Random number: 19972
Fri Nov 27 15:41:53 UTC 2015

# http http://localhost:6081/cgi-bin/foo.sh
HTTP/1.1 200 OK
Accept-Ranges: bytes
Age: 0
Cache-Control: max-age=0
Connection: keep-alive
Content-Length: 57
Content-Type: text/plain
Date: Fri, 27 Nov 2015 15:41:57 GMT
Server: Apache/2.4.10 (Debian)
Via: 1.1 varnish-v4
X-Varnish: 32779

Hello. Random number: 92124
Fri Nov 27 15:41:57 UTC 2015
This example issues two requests against a modified http://localhost:6081/cgi-bin/foo.sh. The modified version has set max-age=0 to tell Varnish - and browsers - not to cache the content at all. A similar example can be used for max-age=10:
# http http://localhost:6081/cgi-bin/foo.sh
HTTP/1.1 200 OK
Accept-Ranges: bytes
Age: 0
Cache-Control: max-age=10
Connection: keep-alive
Content-Length: 57
Content-Type: text/plain
Date: Fri, 27 Nov 2015 15:44:32 GMT
Server: Apache/2.4.10 (Debian)
Via: 1.1 varnish-v4
X-Varnish: 14

Hello. Random number: 19982
Fri Nov 27 15:44:32 UTC 2015

# http http://localhost:6081/cgi-bin/foo.sh
HTTP/1.1 200 OK
Accept-Ranges: bytes
Age: 8
Cache-Control: max-age=10
Connection: keep-alive
Content-Length: 57
Content-Type: text/plain
Date: Fri, 27 Nov 2015 15:44:32 GMT
Server: Apache/2.4.10 (Debian)
Via: 1.1 varnish-v4
X-Varnish: 32782 15

Hello. Random number: 19982
Fri Nov 27 15:44:32 UTC 2015

# http http://localhost:6081/cgi-bin/foo.sh
HTTP/1.1 200 OK
Accept-Ranges: bytes
Age: 12
Cache-Control: max-age=10
Connection: keep-alive
Content-Length: 57
Content-Type: text/plain
Date: Fri, 27 Nov 2015 15:44:32 GMT
Server: Apache/2.4.10 (Debian)
Via: 1.1 varnish-v4
X-Varnish: 19 15

Hello. Random number: 19982
Fri Nov 27 15:44:32 UTC 2015

# http http://localhost:6081/cgi-bin/foo.sh
HTTP/1.1 200 OK
Accept-Ranges: bytes
Age: 2
Cache-Control: max-age=10
Connection: keep-alive
Content-Length: 57
Content-Type: text/plain
Date: Fri, 27 Nov 2015 15:44:44 GMT
Server: Apache/2.4.10 (Debian)
Via: 1.1 varnish-v4
X-Varnish: 65538 20

Hello. Random number: 9126
Fri Nov 27 15:44:44 UTC 2015
This example demonstrates several things:
- Varnish emits an Age header, telling you how old the object is.
- Varnish now caches.
- Varnish delivers a 12-second old object, despite max-age=10!
- Varnish then deliver a 2 second old object? Despite no other request in-between.
What this example is showing, is Varnish's default grace mode. The simple explanation is that Varnish keeps an object a little longer (10 seconds by default) than the regular cache duration. If the object is requested during this period, the cached variant of the object is sent to the client, while Varnish issues a request to the backend server in parallel. This is also called stale while revalidate. This happens even with zero configuration for Varnish, and is covered detailed in later chapters. For now, it's good to just get used to issuing an extra request to Varnish after the expiry time to see the update take place.
Let's do an other example of this, using a browser, and 60 seconds of max age and an ETag header set to something random so our browser can do conditional GET requests:
On the first request we get a 27 second old object.
The second request is a conditional GET request because we had it in cache. Note that our browser has already exceeded the max-age, but still made a conditional GET request. A cache (browser or otherwise) may keep an object longer than the suggested max-age, as long as it verifies the content before using it. The result is the same object, now with an age of 65 seconds.
The third request takes place just 18 seconds later. This is not a conditional GET request, most likely because our browser correctly saw that the Age of the previous object was 65, while max-age=60 instructed the browser to only keep the object until it reached an age of 60 - a time which had already past. Our browser thus did not keep the object at all this time.
Similarly, we can modify foo.sh to emit max-age=3600 and Age: 3590, pretending to be a cache. Speaking directly to Apache:
# http http://localhost:8080/cgi-bin/foo.sh
HTTP/1.1 200 OK
Age: 3590
Cache-Control: max-age=3600
Connection: Keep-Alive
Content-Length: 57
Content-Type: text/plain
Date: Fri, 27 Nov 2015 16:07:36 GMT
ETag: 11235
Keep-Alive: timeout=5, max=100
Server: Apache/2.4.10 (Debian)

Hello. Random number: 54251
Fri Nov 27 16:07:36 UTC 2015

# http http://localhost:8080/cgi-bin/foo.sh
HTTP/1.1 200 OK
Age: 3590
Cache-Control: max-age=3600
Connection: Keep-Alive
Content-Length: 57
Content-Type: text/plain
Date: Fri, 27 Nov 2015 16:07:54 GMT
ETag: 12583
Keep-Alive: timeout=5, max=100
Server: Apache/2.4.10 (Debian)

Hello. Random number: 68323
Fri Nov 27 16:07:54 UTC 2015
Nothing too exciting, but the requests returns what we should have learned to expect by now.
Let's try three requests through Varnish:
# http http://localhost:6081/cgi-bin/foo.sh
HTTP/1.1 200 OK
Accept-Ranges: bytes
Age: 3590
Cache-Control: max-age=3600
Connection: keep-alive
Content-Length: 57
Content-Type: text/plain
Date: Fri, 27 Nov 2015 16:08:50 GMT
ETag: 9315
Server: Apache/2.4.10 (Debian)
Via: 1.1 varnish-v4
X-Varnish: 65559

Hello. Random number: 22609
Fri Nov 27 16:08:50 UTC 2015
The first request is almost identical to the one we issued to Apache, except a few added headers.
15 seconds later, we issue the same command again:
# http http://localhost:6081/cgi-bin/foo.sh
HTTP/1.1 200 OK
Accept-Ranges: bytes
Age: 3605
Cache-Control: max-age=3600
Connection: keep-alive
Content-Length: 57
Content-Type: text/plain
Date: Fri, 27 Nov 2015 16:08:50 GMT
ETag: 9315
Server: Apache/2.4.10 (Debian)
Via: 1.1 varnish-v4
X-Varnish: 32803 65560

Hello. Random number: 22609
Fri Nov 27 16:08:50 UTC 2015
Varnish replies with a version from grace, and has issued an update to Apache in the background. Note that the Age header is now increased, and is clearly beyond the age limit of 3600.
4 seconds later, the third request:
# http http://localhost:6081/cgi-bin/foo.sh
HTTP/1.1 200 OK
Accept-Ranges: bytes
Age: 3594
Cache-Control: max-age=3600
Connection: keep-alive
Content-Length: 57
Content-Type: text/plain
Date: Fri, 27 Nov 2015 16:09:05 GMT
ETag: 24072
Server: Apache/2.4.10 (Debian)
Via: 1.1 varnish-v4
X-Varnish: 65564 32804

Hello. Random number: 76434
Fri Nov 27 16:09:05 UTC 2015
Updated content!
The lessons to pick up from this is:
- Age is not just an informative header. It is used by intermediary caches and by browser caches.
- max-age is relative to Age and not to when the request was made.
- You can have multiple tiers of caches, and max-age=x will be correct for the end user if all intermediary caches correctly obey it and adds to Age.
The Cache-Control header
The Cache-Control header has a multitude of possible values, and can be supplied as both a request-header and response-header. Varnish ignores any Cache-Control header received from a client - other caches might obey them.
It is defined in RFC2616, 14.9. As Varnish ignores all Cache-Control headers in a client request, we will focus on the parts relevant to a HTTP response, here's an excerpt from RFC2616:
Cache-Control   = "Cache-Control" ":" 1#cache-directive

cache-directive = cache-request-directive
     | cache-response-directive

(...)

 cache-response-directive =
       "public"                               ; Section 14.9.1
     | "private" [ "=" <"> 1#field-name <"> ] ; Section 14.9.1
     | "no-cache" [ "=" <"> 1#field-name <"> ]; Section 14.9.1
     | "no-store"                             ; Section 14.9.2
     | "no-transform"                         ; Section 14.9.5
     | "must-revalidate"                      ; Section 14.9.4
     | "proxy-revalidate"                     ; Section 14.9.4
     | "max-age" "=" delta-seconds            ; Section 14.9.3
     | "s-maxage" "=" delta-seconds           ; Section 14.9.3
     | cache-extension                        ; Section 14.9.6

cache-extension = token [ "=" ( token | quoted-string ) ]
Among the above directives, Varnish only obeys s-maxage and max-age by default. It's worth looking closer specially at must-revalidate. This allows a client to cache the content, but requires it to send a conditional GET request before actually using the content.
s-maxage is of special interest to Varnish users. It instructs intermediate caches, but not clients (e.g.: browsers). Varnish will pick the value of s-maxage over max-age, which makes it possible for a web server to emit a Cache-Control header that gives different instructions to browsers and Varnish:
# http http://localhost:6081/cgi-bin/foo.sh
HTTP/1.1 200 OK
Accept-Ranges: bytes
Age: 0
Cache-Control: s-maxage=3600,max-age=5
Connection: keep-alive
Content-Type: text/plain
Date: Fri, 27 Nov 2015 23:21:47 GMT
Server: Apache/2.4.10 (Debian)
Transfer-Encoding: chunked
Via: 1.1 varnish-v4
X-Varnish: 2

Hello. Random number: 7684
Fri Nov 27 23:21:47 UTC 2015

# http http://localhost:6081/cgi-bin/foo.sh
HTTP/1.1 200 OK
Accept-Ranges: bytes
Age: 8
Cache-Control: s-maxage=3600,max-age=5
Connection: keep-alive
Content-Length: 57
Content-Type: text/plain
Date: Fri, 27 Nov 2015 23:21:47 GMT
Server: Apache/2.4.10 (Debian)
Via: 1.1 varnish-v4
X-Varnish: 5 3

Hello. Random number: 7684
Fri Nov 27 23:21:47 UTC 2015

# http http://localhost:6081/cgi-bin/foo.sh
HTTP/1.1 200 OK
Accept-Ranges: bytes
Age: 16
Cache-Control: s-maxage=3600,max-age=5
Connection: keep-alive
Content-Length: 57
Content-Type: text/plain
Date: Fri, 27 Nov 2015 23:21:47 GMT
Server: Apache/2.4.10 (Debian)
Via: 1.1 varnish-v4
X-Varnish: 7 3

Hello. Random number: 7684
Fri Nov 27 23:21:47 UTC 2015
The first request populates the cache, the second returns a cache hit after 8 seconds, while the third confirms that no background fetch has caused an update by returning the same object a third time.
Two important things to note here:
- The Age header is accurately reported. This effectively disables client-side caching after Age has reached 5 seconds.
- There could be other intermediate caches that would also use s-maxage.
The solution to both these issues is the same: Remove or reset the Age-header and remove or reset the s-maxage-part of the Cache-Control header. Varnish does not do this by default, but we will do both in later chapters. For now, just know that these are challenges.
stale-while-revalidate
In addition to RFC2616, there's also the more recent RFC5861 defines two additional variables for Cache-Control:
stale-while-revalidate = "stale-while-revalidate" "=" delta-seconds
and:
stale-if-error = "stale-if-error" "=" delta-seconds
These two variables map very well to Varnish' grace mechanics, which existed a few years before RFC5861 came about.
Varnish 4.1 implements stale-while-revalidate for the first time, but not stale-if-error. Varnish has a default stale-while-revalidate value of 10 seconds. Earlier examples ran into this: You could see responses that were a few seconds older than max-age, while a request to revalidate the response was happening in the background.
A demo of default grace, pay attention to the Age header:
# http -p h http://localhost:6081/cgi-bin/foo.sh
HTTP/1.1 200 OK
Accept-Ranges: bytes
Age: 0
Cache-Control: max-age=5
Connection: keep-alive
Content-Length: 56
Content-Type: text/plain
Date: Sun, 29 Nov 2015 15:10:56 GMT
Server: Apache/2.4.10 (Debian)
Via: 1.1 varnish-v4
X-Varnish: 2

# http -p h http://localhost:6081/cgi-bin/foo.sh
HTTP/1.1 200 OK
Accept-Ranges: bytes
Age: 4
Cache-Control: max-age=5
Connection: keep-alive
Content-Length: 56
Content-Type: text/plain
Date: Sun, 29 Nov 2015 15:10:56 GMT
Server: Apache/2.4.10 (Debian)
Via: 1.1 varnish-v4
X-Varnish: 5 3

# http -p h http://localhost:6081/cgi-bin/foo.sh
HTTP/1.1 200 OK
Accept-Ranges: bytes
Age: 8
Cache-Control: max-age=5
Connection: keep-alive
Content-Length: 56
Content-Type: text/plain
Date: Sun, 29 Nov 2015 15:10:56 GMT
Server: Apache/2.4.10 (Debian)
Via: 1.1 varnish-v4
X-Varnish: 32770 3

# http -p h http://localhost:6081/cgi-bin/foo.sh
HTTP/1.1 200 OK
Accept-Ranges: bytes
Age: 4
Cache-Control: max-age=5
Connection: keep-alive
Content-Length: 56
Content-Type: text/plain
Date: Sun, 29 Nov 2015 15:11:03 GMT
Server: Apache/2.4.10 (Debian)
Via: 1.1 varnish-v4
X-Varnish: 65538 32771
On the third request, Varnish is returning an object that is 8 seconds old, despite the max-age=5 second. When this request was received, Varnish immediately fired off a request to the web server to revalidate the object, but returned the result from cache. This is also demonstrated by the fourth request, where Age is already 4. The fourth request gets the result from the backend-request started when the third request was received. So:
- Request: Nothing in cache. Varnish requests content from backend, waits, and responds with that result.
- Request: Standard cache hit.
- Request: Varnish sees that the object in cache is stale, initiates a request to a backend server, but does NOT wait for the response. Instead, the result from cache is returned.
- Request: By now, the backend-request initiated from the third request is complete. This is thus a standard cache hit.
This behavior means that slow backends will not affect client requests if content is cached.
If this behavior is unwanted, you can disable grace by setting stale-while-revalidate=0:
# http -p h http://localhost:6081/cgi-bin/foo.sh
HTTP/1.1 200 OK
Accept-Ranges: bytes
Age: 0
Cache-Control: max-age=5, stale-while-revalidate=0
Connection: keep-alive
Content-Length: 57
Content-Type: text/plain
Date: Thu, 03 Dec 2015 12:50:36 GMT
Server: Apache/2.4.10 (Debian)
Via: 1.1 varnish-v4
X-Varnish: 12

# http -p h http://localhost:6081/cgi-bin/foo.sh
HTTP/1.1 200 OK
Accept-Ranges: bytes
Age: 3
Cache-Control: max-age=5, stale-while-revalidate=0
Connection: keep-alive
Content-Length: 57
Content-Type: text/plain
Date: Thu, 03 Dec 2015 12:50:36 GMT
Server: Apache/2.4.10 (Debian)
Via: 1.1 varnish-v4
X-Varnish: 32773 13

# http -p h http://localhost:6081/cgi-bin/foo.sh
HTTP/1.1 200 OK
Accept-Ranges: bytes
Age: 0
Cache-Control: max-age=5, stale-while-revalidate=0
Connection: keep-alive
Content-Length: 57
Content-Type: text/plain
Date: Thu, 03 Dec 2015 12:50:42 GMT
Server: Apache/2.4.10 (Debian)
Via: 1.1 varnish-v4
X-Varnish: 32775

# http -p h http://localhost:6081/cgi-bin/foo.sh
HTTP/1.1 200 OK
Accept-Ranges: bytes
Age: 1
Cache-Control: max-age=5, stale-while-revalidate=0
Connection: keep-alive
Content-Length: 57
Content-Type: text/plain
Date: Thu, 03 Dec 2015 12:50:42 GMT
Server: Apache/2.4.10 (Debian)
Via: 1.1 varnish-v4
X-Varnish: 15 32776
This was added in Varnish 4.1.0. We can now see that no background fetching was done at all, and no stale objects were delivered. In other words:
- Request: Nothing in cache. Varnish requests content from backend, waits, and responds with that result.
- Request: Standard cache hit.
- Request: Nothing in cache. Varnish fetches content form backend, waits and responds with that result.
- Request: Standard cache hit.
Vary
The Vary-header is exclusively meant for intermediate caches, such as Varnish. It is a comma-separated list of references to request headers that will cause the web server to produce a different variant of the same content. An example is needed:
# http -p Hhb http://localhost:6081/cgi-bin/foo.sh "X-demo: foo"
GET /cgi-bin/foo.sh HTTP/1.1
Accept: */*
Accept-Encoding: gzip, deflate
Connection: keep-alive
Host: localhost:6081
User-Agent: HTTPie/0.8.0
X-demo:  foo

HTTP/1.1 200 OK
Accept-Ranges: bytes
Age: 6
Cache-Control: s-maxage=3600
Connection: keep-alive
Content-Length: 57
Content-Type: text/plain
Date: Fri, 27 Nov 2015 23:56:47 GMT
Server: Apache/2.4.10 (Debian)
Vary: X-demo
Via: 1.1 varnish-v4
X-Varnish: 12 32771

Hello. Random number: 21126
Fri Nov 27 23:56:47 UTC 2015

# http -p Hhb http://localhost:6081/cgi-bin/foo.sh "X-demo: bar"
GET /cgi-bin/foo.sh HTTP/1.1
Accept: */*
Accept-Encoding: gzip, deflate
Connection: keep-alive
Host: localhost:6081
User-Agent: HTTPie/0.8.0
X-demo:  bar

HTTP/1.1 200 OK
Accept-Ranges: bytes
Age: 0
Cache-Control: s-maxage=3600
Connection: keep-alive
Content-Length: 57
Content-Type: text/plain
Date: Fri, 27 Nov 2015 23:56:57 GMT
Server: Apache/2.4.10 (Debian)
Vary: X-demo
Via: 1.1 varnish-v4
X-Varnish: 32773

Hello. Random number: 126
Fri Nov 27 23:56:57 UTC 2015

# http -p Hhb http://localhost:6081/cgi-bin/foo.sh "X-demo: foo"
GET /cgi-bin/foo.sh HTTP/1.1
Accept: */*
Accept-Encoding: gzip, deflate
Connection: keep-alive
Host: localhost:6081
User-Agent: HTTPie/0.8.0
X-demo:  foo

HTTP/1.1 200 OK
Accept-Ranges: bytes
Age: 15
Cache-Control: s-maxage=3600
Connection: keep-alive
Content-Length: 57
Content-Type: text/plain
Date: Fri, 27 Nov 2015 23:56:47 GMT
Server: Apache/2.4.10 (Debian)
Vary: X-demo
Via: 1.1 varnish-v4
X-Varnish: 14 32771

Hello. Random number: 21126
Fri Nov 27 23:56:47 UTC 2015

# http -p Hhb http://localhost:6081/cgi-bin/foo.sh "X-demo: bar"
GET /cgi-bin/foo.sh HTTP/1.1
Accept: */*
Accept-Encoding: gzip, deflate
Connection: keep-alive
Host: localhost:6081
User-Agent: HTTPie/0.8.0
X-demo:  bar

HTTP/1.1 200 OK
Accept-Ranges: bytes
Age: 8
Cache-Control: s-maxage=3600
Connection: keep-alive
Content-Length: 57
Content-Type: text/plain
Date: Fri, 27 Nov 2015 23:56:57 GMT
Server: Apache/2.4.10 (Debian)
Vary: X-demo
Via: 1.1 varnish-v4
X-Varnish: 32776 32774

Hello. Random number: 126
Fri Nov 27 23:56:57 UTC 2015
These four requests demonstrates that two objects are entered into the cache for the same URL, accessible by modifying the arbitrarily chosen X-demo request header - which is not a real header.
The most important use-case for Vary is to support content encoding such as gzip. In earlier versions of Varnish, the web server needed to do the compression and Varnish would store the compressed content and (assuming a client asked for it), the uncompressed content. This was supported through the Vary header, which the server would set to Vary: Accept-Encoding. Today, Varnish understands gzip and this isn't needed. There are two more examples of Vary-usage.
Mobile devices are often served different variants of the same contents, so called mobile-friendly pages. To make sure intermediate caches supports this, Varnish must emit a Vary: User-Agent string, suggesting that for each different User-Agent header sent, a unique variant of the cache must be made.
The second such header is the nefarious Cookie header. Whenever a page is rendered differently based on a cookie, the web server should send Vary: Cookie. However, hardly anyone do this in the real world, which has resulted in cookies being treated differently. Varnish does not cache any content if it's requested with a cookie by default, nor does it cache any response with a Set-Cookie-header. This clearly needs to be overridden, and will be covered in detail in later chapters.
The biggest problem with the Vary-header is the lack of semantic details. The Vary header simply states that any variation in the request header, however small, mandates a new object in the cache. This causes numerous headaches. Here are some examples:
- Accept-Enoding: gzip,deflate and Accept-Encoding: deflate,gzip will result in two different variants.
- Vary: User-Agent will cause a tremendous amount of variants, since the level of detail in modern User-Agent headers is extreme.
- It's impossible to say that only THAT cookie will matter, not the others.
Many of these things can be remedied or at least worked around in Varnish. All of it will be covered in detail in separate chapters.
On a last note, Varnish has a special case were it refuse to cache any content with a response header of Vary: *.
Request methods
Only the GET request method is cached. However, Varnish will re-write a HEAD request to a GET request, cache the result and strip the response body before answering the client. A HEAD request is supposed to be exactl the same as a GET request, with the response body stripped, so this makes sense. To see this effect, issue a HEAD request first directly to Apache:
# http -p Hhb HEAD http://localhost:8080/cgi-bin/foo.sh
HEAD /cgi-bin/foo.sh HTTP/1.1
Accept: */*
Accept-Encoding: gzip, deflate
Connection: keep-alive
Host: localhost:8080
User-Agent: HTTPie/0.8.0

HTTP/1.1 200 OK
Connection: Keep-Alive
Content-Length: 29
Content-Type: text/plain
Date: Sat, 28 Nov 2015 00:30:33 GMT
Keep-Alive: timeout=5, max=100
Server: Apache/2.4.10 (Debian)

# tail -n1 /var/log/apache2/access.log
::1 - - [28/Nov/2015:00:30:33 +0000] "HEAD /cgi-bin/foo.sh HTTP/1.1" 200 190 "-" "HTTPie/0.8.0"
The access log shows a HEAD request. Issuing the same request to Varnish:
# http -p Hhb HEAD http://localhost:6081/cgi-bin/foo.sh
HEAD /cgi-bin/foo.sh HTTP/1.1
Accept: */*
Accept-Encoding: gzip, deflate
Connection: keep-alive
Host: localhost:6081
User-Agent: HTTPie/0.8.0

HTTP/1.1 200 OK
Age: 0
Connection: keep-alive
Content-Length: 29
Content-Type: text/plain
Date: Sat, 28 Nov 2015 00:32:05 GMT
Server: Apache/2.4.10 (Debian)
Via: 1.1 varnish-v4
X-Varnish: 2

# tail -n1 /var/log/apache2/access.log
127.0.0.1 - - [28/Nov/2015:00:32:05 +0000] "GET /cgi-bin/foo.sh HTTP/1.1" 200 163 "-" "HTTPie/0.8.0"
The client sees the same result, but the web server has logged a GET request. Please note that HEAD-requests include a Content-Lenght as if a GET-request was issued. It is only the response body itself that is absent.
Cached status codes
Only a subset of response odes allow cacheing, even if an s-maxage or similar is provided. Quoting directly from Varnish source code, specifically bin/varnishd/cache/cache_rfc2616.c, the list is:
case 200: /* OK */
case 203: /* Non-Authoritative Information */
case 204: /* No Content */
case 300: /* Multiple Choices */
case 301: /* Moved Permanently */
case 304: /* Not Modified - handled like 200 */
case 404: /* Not Found */
case 410: /* Gone */
case 414: /* Request-URI Too Large */
That means that if you provide s-maxage on a 500 Internal Server Error, Varnish will still not cache it by default. Varnish will cache the above status codes even without any cache control headers. The default cache duration is 2 minutes.
In addition to the above, there are two more status codes worth mentioning:
case 302: /* Moved Temporarily */
case 307: /* Temporary Redirect */
        /*
         * https://tools.ietf.org/html/rfc7231#section-6.1
         *
         * Do not apply the default ttl, only set a ttl if Cache-Control
         * or Expires are present. Uncacheable otherwise.
         */
        expp->ttl = -1.;
Responses with status codes 302 Moved Temporarily or 307 Temporary Redirect are only cached if Cache-Control or Expires explicitly allows it, but not cached by default.
In other words:
- max-age=10 + 500 Internal Server Error: Not cached
- max-age=10 + 302 Moved Temporarily: Cached
- No Cache-Control + 302 Moved Temporarily: Not cached
- No Cache-Control + 404 Not Found: Cached
Cookies and authorization
Requests with a cookie-header or HTTP basic authorization header are tricky at best to cache. Varnish takes a "better safe than sorry" approach, and does not cache responses to requests with either a Cookie-header, Authorization-header by default. Responses with Set-Cookie are not cached.
Because cookies are so common, this will generally mean that any modern site is not cached by default. Fortunately, Varnish has the means to override that default. We will investigate that in detail in later chapters.
Summary
There are a few other headers worth mentioning. The ancient Pragma header is still seen, and completely ignored by Varnish and generally replaced by Cache-Control. One header Varnish does care about is Expires. Expires is generally deprecated, but still valid.
If s-maxage and max-age is missing from Cache-Control, then Varnish will use an Expires header. The format of the Expires header is that of an absolute date - the same format as Date and Last-Modified. Don't use this unless you want a headache.
In other words, to cache by default:
- The request method must be GET or HEAD.
- There can be no Cookie-header or Authorize-header in the request.
- There can be no Set-Cookie on the reply.
- The status code needs to be 200, 203, 204, 300, 301, 304, 404, 410, 414.
- OR the status code can be 302 or 307 IF Cache-Control or Expires enables caching.
- Vary must NOT be *.
Varnish decides cache duration (TTL) in the following order:
- If Cache-Control has s-maxage, that value is used.
- Otherwise, if Cache-Control has max-age, that value is used.
- Otherwise, if Expires is present, that value is used.
- Lastly, Varnish uses default fall-back value. This is 2 minutes by default, as dictated by the default_ttl parameter.
Our goal when designing cache policies is to push as much of the logic to the right place. The right place for setting cache duration is usually in the application, not in Varnish. A good policy is to use s-maxage.
Varnish Foo - Introduction
Posted on 2015-11-24
This is the only chapter written in first person.
I've worked on Varnish since late 2008, first for Redpill Linpro, then Varnish Software, then, after a brief pause, for Redpill Linpro again. Over the years I've written code, written Varnish modules and blog posts, tried to push the boundaries of what Varnish can do, debugged or analyzed countless Varnish sites, probably held more training courses than anyone else, written training material, and helped shape the Varnish community.
Today I find myself in a position where the training material I once maintained is no longer my responsibility. But I still love writing, and there's an obvious need for documentation for Varnish.
I came up with a simple solution: I will write a book. Because I couldn't imagine that I would ever finish it if I attempted writing a whole book in one go, I decided I would publish one chapter at a time on my blog. This is the first chapter of that book.
You will find the source on https://github.com/KristianLyng/varnishfoo. This is something I am doing on my spare time, and I hope to get help from the Varnish community in the form of feedback. While the format will be that of a book, I intend to keep it alive with updates as long as I can.
I intend to cover as much Varnish-related content as possible, from administration to web development and infrastructure. And my hope is that one day, this will be good enough that it will be worth printing as more than just a leaflet.
I am writing this in my spare time, I retain full ownership of the material. For now, the material is available under a Creative Commons "CC-BY-SA-NC" license. The NC-part of that license will be removed when I feel the material has matured enough and the time is right. To clarify, the "non-commercial" clause is aimed at people wanting to sell the book or use it in commercial training (or similar) - it is not intended to prevent you from reading the material at work.
Target audience and format
This book covers a large spectre of subjects related to Varnish. It is suitable for system administrators, infrastructure architects and web developers. The first few chapters is general enough to be of interest to all, while later chapters specialize on certain aspects of Varnish usage.
Each chapter is intended to stand well on its own, but there will be some cross-references. The book focuses on best practices and good habits that will help you beyond what just a few examples or explanations will do.
Each chapter provides both theory and practical examples. Each example is tested with a recent Varnish Version where relevant, and are based on experience from real-world Varnish installations.
What is Varnish
Varnish is a web server.
Unlike most web servers, Varnish does not read content from a hard drive, or run programs that generates content from SQL databases. Varnish acquires the content from other web servers. Usually it will keep a copy of that content around in memory for a while to avoid fetching the same content multiple times, but not necessarily.
There are numerous reasons you might want Varnish:
- Your web server/application is a beastly nightmare where performance is measured in page views per hour - on a good day.
- Your content needs to be available from multiple geographically diverse locations.
- Your web site consists of numerous different little parts that you need to glue together in a sensible manner.
- Your boss bought a service subscription and now has to justify the budget post.
- You like Varnish.
- ???
Varnish is designed around two simple concepts: Give you the means to fix or work around technical challenges. And speed. Speed was largely handled very early on, and Varnish is quite simply fast. This is achieved by being, at the core, simple. The less you have to do for each request, the more requests you can handle.
The name suggests what it's all about:
From The Collaborative International Dictionary of English v.0.48 [gcide]:

  Varnish \Var"nish\, v. t. [imp. & p. p. {Varnished}; p. pr. &
     vb. n. {Varnishing}.] [Cf. F. vernir, vernisser. See
     {Varnish}, n.]
     [1913 Webster]
     1. To lay varnish on; to cover with a liquid which produces,
        when dry, a hard, glossy surface; as, to varnish a table;
        to varnish a painting.
        [1913 Webster]

     2. To cover or conceal with something that gives a fair
        appearance; to give a fair coloring to by words; to gloss
        over; to palliate; as, to varnish guilt. "Beauty doth
        varnish age." --Shak.
        [1913 Webster]
Varnish can be used to smooth over rough edges in your stack, to give a fair appearance.
History
The Varnish project began in 2005. The issue to be solved was that of VG, a large Norwegian news site (or alternatively a tiny international site). The first release came in 2006, and worked well for pretty much one site: www.vg.no. In 2008, Varnish 2.0 came, which opened Varnish up to more sites, as long as they looked and behaved similar to www.vg.no. As time progressed and more people started using Varnish, Varnish has been adapted to a large and varied set of use cases.
From the beginning, the project was administered through Redpill Linpro, with the majority of development being done by Poul-Henning Kamp through his own company and his Varnish Moral License. In 2010, Varnish Software sprung out from Redpill Linpro. Varnish Cache has always been a free software project, and while Varnish Software has been custodians of the infrastructure and large contributors of code and cash, the project is independent.
Varnish Plus was born some time during 2011, all though it didn't go by that name at the time. It was the result of somewhat conflicting interests. Varnish Software had customer obligations that required features, and the development power to implement them, but they did not necessarily align with the goals and time frames of Varnish Cache. Varnish Plus became a commercial test-bed for features that were not /yet/ in Varnish Cache for various reasons. Many of the features have since trickled into Varnish Cache proper in one way or an other (streaming, surrogate keys, and more), and some have still to make it. Some may never make it. This book will focus on Varnish Cache proper, but will reference Varnish Plus where it makes sense.
With Varnish 3.0, released in 2011, varnish modules started becoming a big thing. These are modules that are not part of the Varnish Cache code base, but are loaded at run-time to add features such as cryptographic hash functions (vmod-digest) and memcached. The number of vmods available grew quickly, but even with Varnish 4.1, the biggest issue with them were that they required source-compilation for use. That, however, is being fixed almost as I am writing this sentence.
Varnish would not be where it is today without a large number of people and businesses. Varnish Software have contributed and continues to contribute numerous tools, vmods, and core features. Poul-Henning Kamp is still the gatekeeper of Varnish Cache code, for better or worse, and does the majority of the architectural work. Over the years, there have been too many companies and individuals involved to list them all in a book, so I will leave that to the official Varnish Cache project.
Today, Varnish is used by CDNs and news papers, APIs and blogs.
More than just cache
Varnish caches content, but can do much more. In 2008, it was used to rewrite URLs, normalize HTTP headers and similar things. Today, it is used to implement paywalls (whether you like them or not), API metering, load balancing, CDNs, and more.
Varnish has a powerful configuration language, the Varnish Configuration Language (VCL). VCL isn't parsed the traditional way a configuration file is, but is translated to C code, compiled and linked into the running Varnish. From the beginning, it was possible to bypass the entire translation process and provide C code directly, which was never recommended. With Varnish modules, it's possible to write proper modules to replace the in-line C code that was used in the past.
There is also a often overlooked Varnish agent that provides a HTTP REST interface to managing Varnish. This can be used to extract metrics, review or optionally change configuration, stop and start Varnish, and more. The agent lives on https://github.com/varnish/vagent2, and is packaged for most distributions today. There's also a commercial administration console that builds further on the agent.
Using Varnish to gracefully handle operational issues is also common. Serving cached content past its expiry time while a web server is down, or switching to a different server, will give your users a better browsing experience. And in a worst case scenario, at least the user can be presented with a real error message instead of a refused or timed out connection.
An often overlooked feature of Varnish is Edge Side Includes. This is a means to build a single HTTP object (like a HTML page) from multiple smaller object, with different caching properties. This lets content writers provide more fine-grained caching strategies without having to be too smart about it.
Where to get help
The official varnish documentation is available both as manual pages (run man -k varnish on a machine with a properly installed Varnish package), and as Sphinx documentation found under http://varnish-cache.org/docs/.
Varnish Software has also publish their official training material, which is called "The Varnish Book" (Not to be confused with THIS book about Varnish). This is available freely through their site at http://varnish-software.com, after registration.
An often overlooked source of information for Varnish are the flow charts/dot-graphs used to document the VCL state engine. The official location for this is only found in the source code of Varnish, under doc/graphviz/. They can be generated simply, assuming you have graphviz installed:
# git clone http://github.com/varnish/Varnish-Cache/
Cloning into 'Varnish-Cache'...
(...)
# cd Varnish-Cache/
# cd doc/graphviz/
# for a in *dot; do dot -Tpng $a > $(echo $a | sed s/.dot/.png/); done
# ls *png
Alternatively, replace -Tpng and .png with -Tsvg and .svg respectively to get vector graphics, or -Tpdf/.pdf for pdfs.
You've now made three graphs that you might as well print right now and glue to your desk if you will be working with Varnish a lot.
For convenience, the graphs from Varnish 4.1 are included. If you don't quite grasp what these tell you yet, don't be too alarmed. These graphs are provided early as they are useful to have around as reference material. A brief explanation for each is included, mostly to help you in later chapters.
cache_req_fsm.png
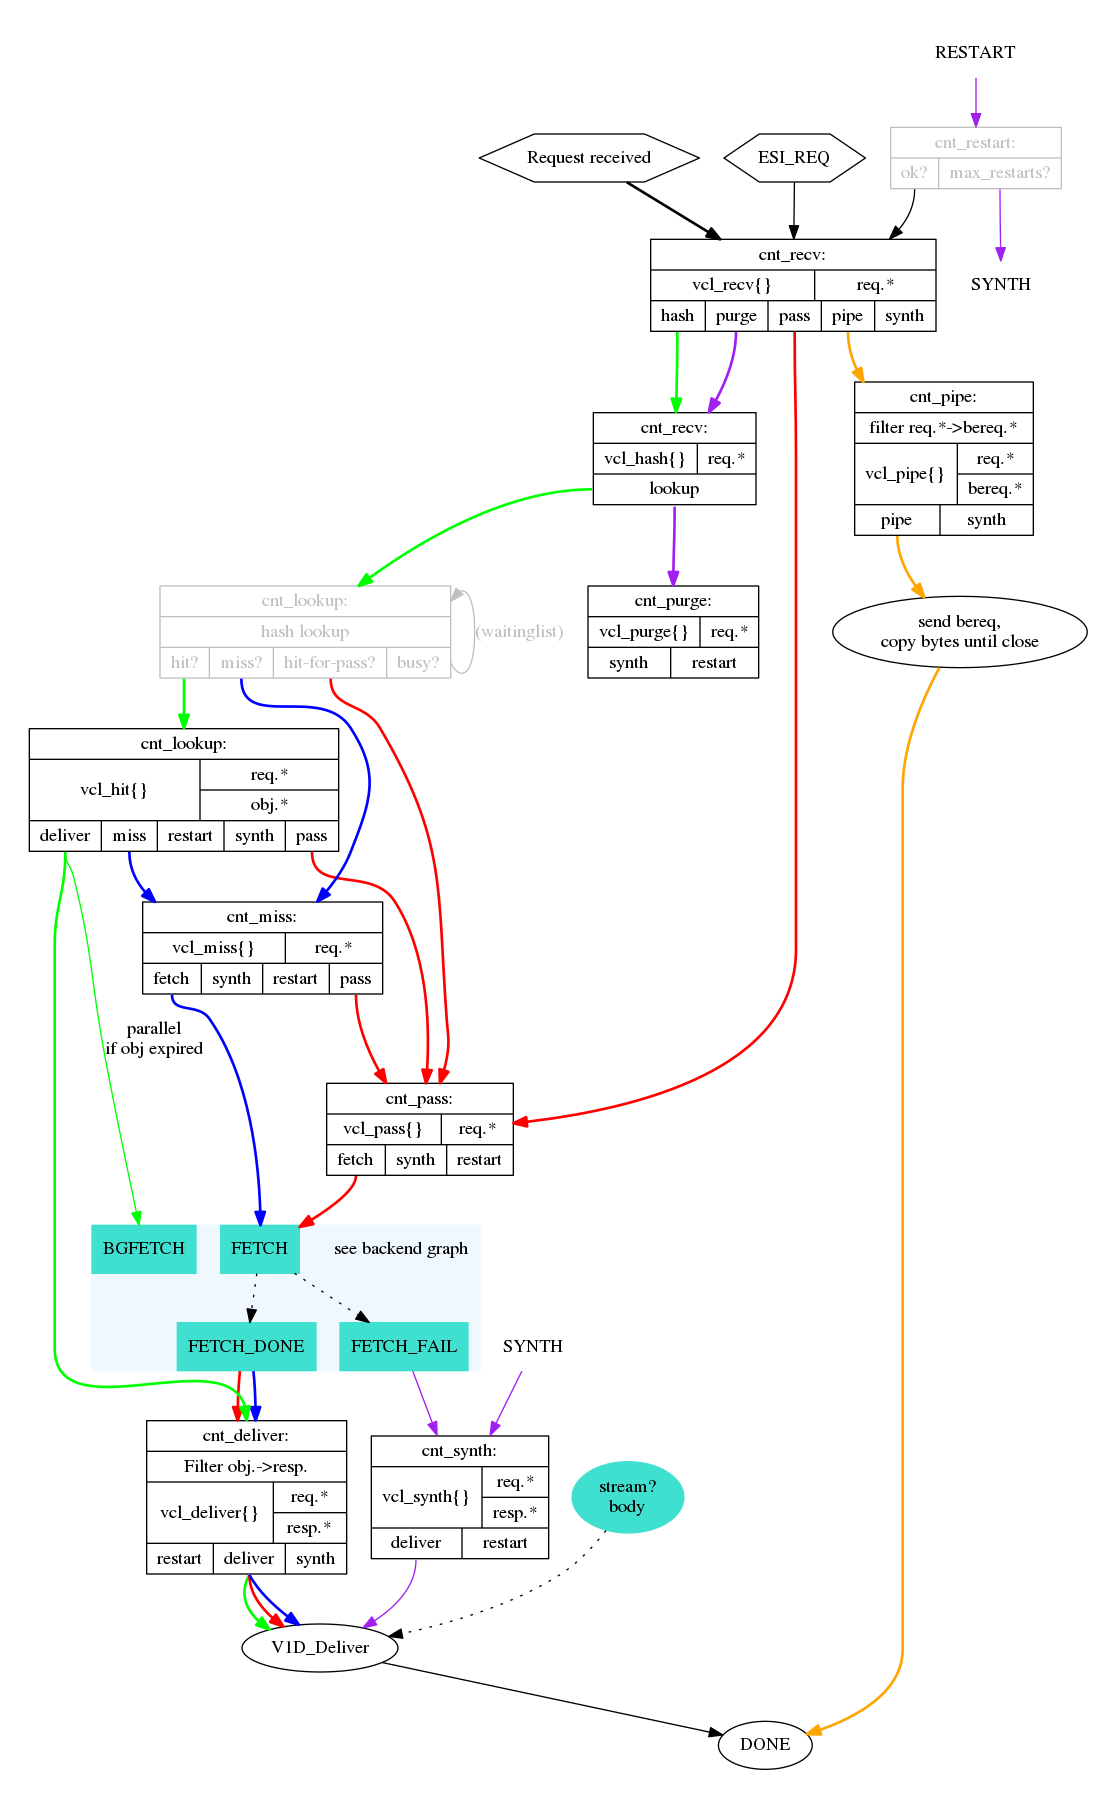
This can be used when writing VCL. You want to look for the blocks that read vcl_ to identify VCL functions. The lines tell you how a return-statement in VCL will affect the VCL state engine at large, and which return statements are available where. You can also see which objects are available where.
This particular graph details the client-specific part of the VCL state engine.
cache_fetch.png
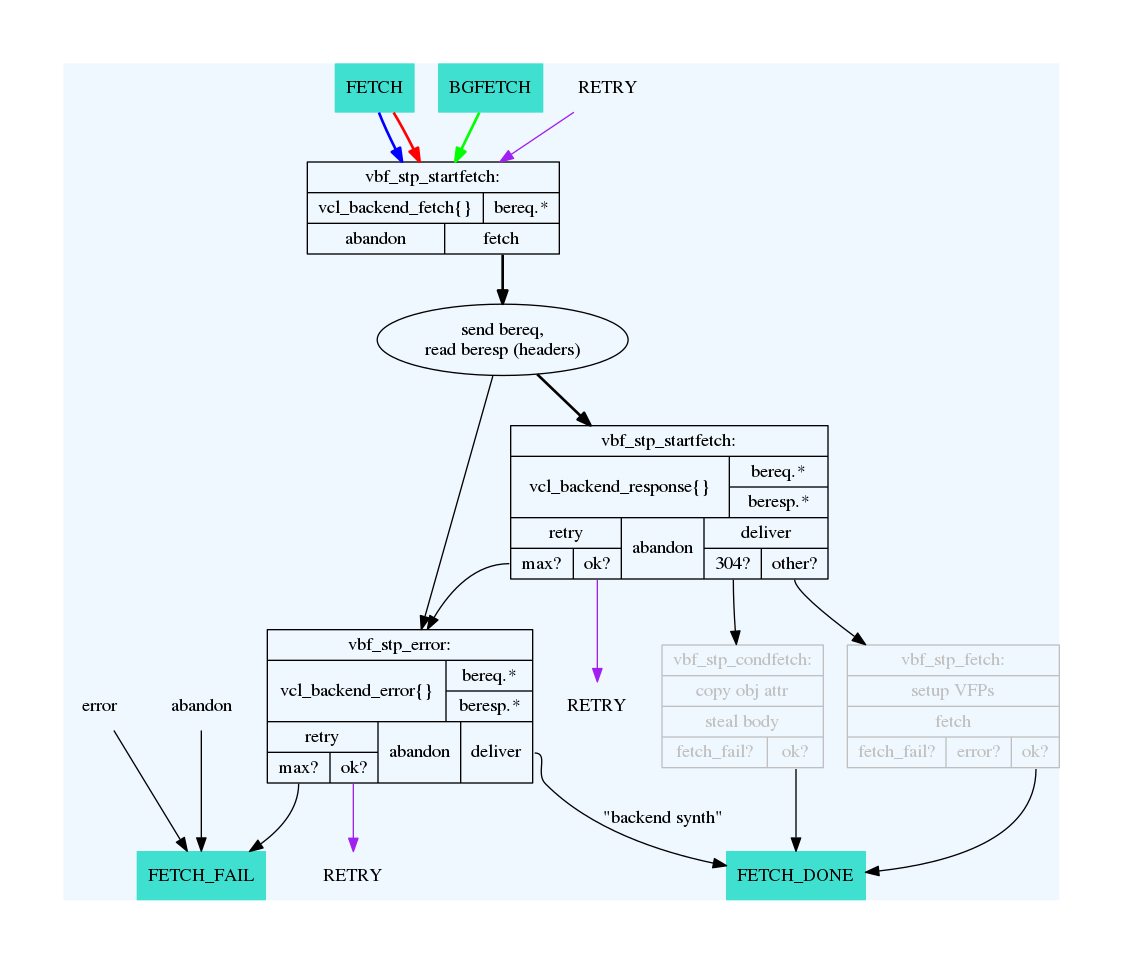
This graph has the same format as the cache_req_fsm.png-one, but from the perspective of a backend request.
cache_http1_fsm.png
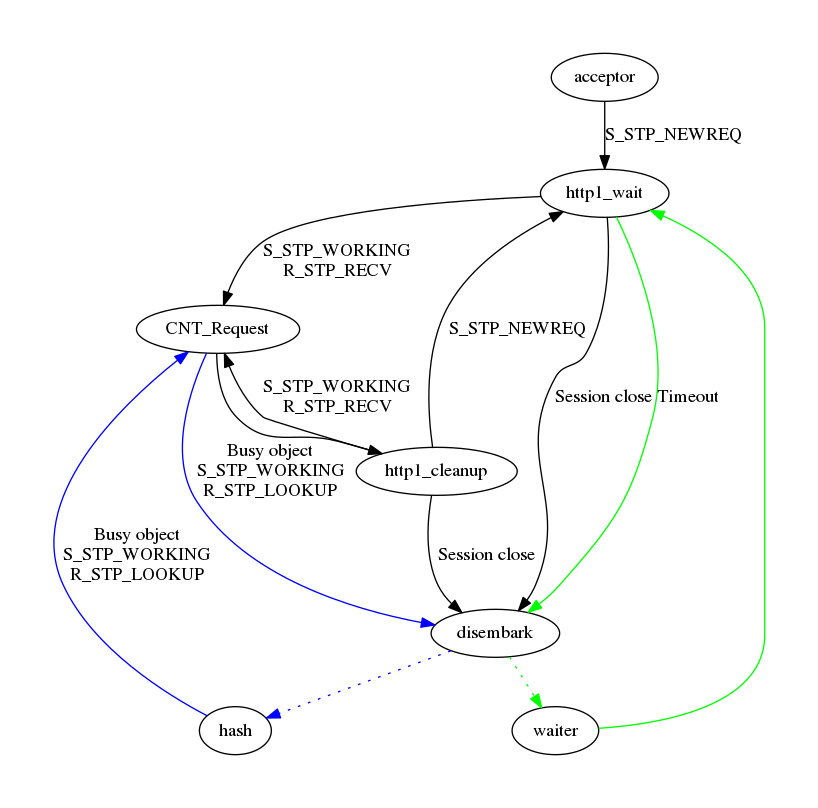
Of the three, this is the least practical flow chart, mainly included for completeness. It does not document much related to VCL or practical Varnish usage, but the internal state engine of an HTTP request in Varnish. It can sometimes be helpful for debugging internal Varnish issues.