Getting Junos Telemetry working using Skogul and InfluxDB
Posted on 2020-01-13
For the last year and a half, I've been working on improving the networking monitoring system here at Telenor Norge. With a network that consists of thousands of sites, that's a big topic to cover, but one of the more interesting bits we're doing is introducing Juniper's "streaming telemetry" as a replacement/supplement to SNMP.
This means that instead of having an SNMP poller, our routers will send the data directly to our collectors, as configured by the router.
This is still very new stuff and it can be a bit rough around the edges, but the core functionality works quite well. Juniper has chosen to implement this using Google Protocol Buffers, which I honestly don't think is a great idea for the industry as a whole, but it's not too bad either. It doesn't take much to out shine SNMP.
Since one of the first things we realized when designing a new monitoring system was that we wanted to decouple how we receive data from how we store it, I set about writing Skogul (https://github.com/telenornms/skogul), and it's Open Source. And it supports Junipers streaming telemetry out of the box.
Skogul is able to accept various types of data, parse it into a common internal format, and pass it on to a number of different places. In this blog post, I'll show you how you can configure your Juniper MX routers to send telemetry, set up Skogul to receive it, parse it and store it in InfluxDB.
What I will _not_ cover is how to set up InfluxDB. There are plenty of guides for that.
Step 1: Junos config
You need to configure three items, all in services analytics. This is an example config:
streaming-server telemetry_1 {
    remote-address 192.168.0.10;
    remote-port 3300;
}
streaming-server telemetry_2 {
    remote-address 192.168.0.20;
    remote-port 3300;
}
export-profile export_fast {
    reporting-rate 6;
    payload-size 3000;
    format gpb;
    transport udp;
}
export-profile export_medium {
    reporting-rate 30;
    payload-size 3000;
    format gpb;
    transport udp;
}
export-profile export_slow {
    reporting-rate 300;
    payload-size 3000;
    format gpb;
    transport udp;
}

sensor xx_linecard_intf-exp {
    server-name [ telemetry_1 telemetry_2 ];
    export-name export_medium;
    resource /junos/system/linecard/intf-exp/;
}
sensor xx_linecard_optics {
    server-name [ telemetry_1 telemetry_2 ];
    export-name export_slow;
    resource /junos/system/linecard/optics/;
}
sensor xx_interfaces_interface {
    server-name [ telemetry_1 telemetry_2 ];
    export-name export_fast;
    resource /junos/system/linecard/interface/;
}
sensor xx_interfaces_interface_subinterfaces {
    server-name [ telemetry_1 telemetry_2 ];
    export-name export_medium;
    resource /junos/system/linecard/interface/logical/usage/;
}
First, this sets up two different servers that will receive the telemetry stream. You don't need two, obviously, but redundancy is nice.
Second, the export profiles are defined. It's a good idea to differentiate between data. A few minor notes here: If you do not have jumbo frames all the way from your routers to your collectors, you need to set payload size. BUT, this number doesn't mean what you think it means. This is a value we've set to get the UDP packets to actually be <1500 bytes. How setting a value to 3000 results in a packet size of 1500? Well, let's just say we have an open dialog about this :)
Last, we set up four sensors. Both Skogul and Junos support more than this, but these are by far the most useful ones. I've prefixed each sensor with "xx", which is obviously optional. You can call them whatever.
The four sensors are:
- intf-exp, think operstatus.
- linecard/optics, optical power dampening data. You don't need this very frequently, so it's using a slow export profile.
- linecard/interface, this is traffic data and much more for physical interfaces. Think "ifTable", except it also includes queue stats and more.
- linecard/interface/logical/usage, very similar to linecard/interface, except for logical interfaces.
Check out Junipers own documentation for more details on other sensors.
Once you've configured this, you should verify that you are receiving data at the collector-side.
Step 2: Skogul basics
Grab the latest Skogul release from https://github.com/telenornms/skogul/releases and install it. The github page should have plenty of installation instructions. We provide pre-built binaries for Red Hat - including systemd units, and a generic 64bit build for Linux. If you need or want Debian packages, patches are more than welcome (or a github issue). In the meanwhile, you should be able to get it working using just the generic binary and the Systemd service file found in the repo.
Skogul comes with the Junos telemetry protocol buffers bundled, so you don't have to think about that at all (be thankful... long story).
Once you've installed it, you need a configuration. Skogul uses a single JSON file as configuration, and the configuration consists of several small modules. We are going to set up a single receiver - the UDP receiver. This will use a single handler to deal with data. In our case, the handler will use protobuf as a parser, a set of transformers to "flatten" the data structure, and a sender that consists of first a "duplicate", then both "debug" and "influxdb".
In reality, our production installation is slightly more complex. We receive the telemetry data from the network at one server, then re-send it as HTTP JSON data to an other server which stores it. But this is more complex than we need it to be for our example.
First, our working config, with 0 transformers and only debug:
{
  "receivers": {
      "udp": {
        "type": "udp",
        "address": ":3300",
        "handler": "protobuf"
      }
  },
  "handlers": {
    "protobuf": {
      "parser": "protobuf",
      "transformers": [],
      "sender": "print"
    }
  },
  "senders": {
    "print": {
        "type": "debug"
    }
  }
}
Using this configuration, Skogul should start printing JSON-formatted telemetry-data to stdout (so either run it on the command line, or look at the journal).
If this doesn't print anything sensible, something is wrong.
Step 3: Flattening
Skogul's implementation of Juniper's Streaming Telemetry is generic. It can parse anything that was part of the most recently imported Junos telemetry files.
But Skogul doesn't have a preference for storage engine. You can store the incoming data as JSON in a postgres database (we do this for debugging). Or you can store it in InfluxDB.
However, since the telemetry data is a nested data structure, we need to un-nest it. Instead of writing a set of hard-coded hacks to accomplish this, Skogul has a concept of "transformers". A transformer looks at the incoming data and, you guessed it, transforms it.
The simplest transformers can do stuff like add or remove key/value pairs. The ones that are more interesting for us will iterate over an array and split it into multiple metrics.
E.g.: Since a single telemetry packet can include data for numerous interfaces, we use a transformer to create unique metrics for each interface.
And we use transformer to change:
"ingress_stats": {
   "if_octets": 123
},
"egress_stats": {
   "if_octets": 123
}
Into:
"ingress_stats__if_octets": 123,
"egress_stats__if_octets": 123
This is all for the benefit of InfluxDB, which (reasonably enough) doesn't support nested data structures.
We also do a few minor tricks with transformers, such as move "if_name" from the data-field to metadata, turning it into a searchable tag in InfluxDB. Feel free to experiment with this.
You can write your own configuration for any data skogul can parse.
One last thing we do, which is critical for our convenience, is that we store the sensor-name as a metadata field. We then use this as the "measurement" to store data to in the InfluxDB sender. We need to do some regex-cleaning on it too, since influxdb isn't very fond of using "/junos/system/linecard/interface/" as a measurement name.
Re-using the previous configuration:
{
  "receivers": {
      "udp": {
        "type": "udp",
        "address": ":3300",
        "handler": "protobuf"
      }
  },
  "handlers": {
    "protobuf": {
      "parser": "protobuf",
      "transformers": [
          "interfaceexp_stats",
          "interface_stats",
          "interface_info",
          "optics_diag",
          "interfaces_interface",
          "flatten",
          "remove",
          "extract_names",
          "extract_measurement_name",
          "extract_measurement_name2",
          "flatten_systemId"
      ],
      "sender": "print"
    }
  },
  "senders": {
    "print": {
        "type": "debug"
    }
  },
  "transformers": {
     "interfaceexp_stats": {
        "type": "split",
        "field": ["interfaceExp_stats"]
     },
     "interfaces_interface": {
        "type": "split",
        "field": ["interface"]
     },
     "interface_stats": {
        "type": "split",
        "field": ["interface_stats"]
     },
     "interface_info": {
        "type": "split",
        "field": ["interface_info"]
     },
     "optics_diag": {
        "type": "split",
        "field": ["Optics_diag"]
     },
     "flatten": {
        "type": "data",
        "flatten": [
           ["aggregation","state"],
           ["egress_queue_info"],
           ["egress_errors"],
           ["egress_stats"],
           ["ingress_errors"],
           ["ingress_stats"],
           ["egress_stats"],
           ["ingress_stats"],
           ["op_state"],
           ["optics_diag_stats"],
           ["optics_diag_stats__optics_lane_diag_stats"]
        ]
     },
     "remove": {
        "type": "data",
        "remove": [
           "aggregation",
           "egress_queue_info",
           "egress_errors",
           "egress_stats",
           "ingress_errors",
           "ingress_stats",
           "egress_stats",
           "ingress_stats",
           "op_state",
           "optics_diag_stats",
           "optics_diag_stats__optics_lane_diag_stats"
        ]
     },
     "extract_names": {
        "type": "metadata",
        "extractFromData": ["if_name", "parent_ae_name","name"]
     },
     "extract_measurement_name": {
        "type": "replace",
        "regex": "^([^:]*):/([^:]*)/:.*$",
        "source": "sensorName",
        "destination": "measurement",
        "replacement": "$2"
     },
     "extract_measurement_name2": {
        "type": "replace",
        "regex": "[^a-zA-Z]",
        "source": "measurement",
        "replacement": "_"
     },
     "flatten_systemId": {
        "type": "replace",
        "regex": "-.*$",
        "source": "systemId"
     }
  }
}
This exact configuration should work, and still print JSON data, but now you will have "flat" json-data.
Arguably all these transformers make the configuration a bit extensive, and since this is NOT a "clean" config, but the result of what we actually have working after experimentation and simultaneously developing the necessary tranformers. We wanted the transformers to be completely generic, which makes for a very powerful tool, if somewhat extensive configuration.
We'll likely add a "library" or similar to skogul, where we can ship configuration such as this and you can just include it. But for now, you'll just have to copy/paste it.
Also, this isn't optimal CPU-wise - it will attempt all transformations for all sensors. But it's fast enough that it doesn't matter that much. We've written a new transformer to address this, but haven't configured it yet.
If you are not seeing valid JSON data that looks "flat" (e.g.: no arrays or nested objects in the "data" and "metadata" structures), then you need to review the previous steps (or nag me if I made a typo).
Step 4: Writing to influxdb
You've already got InfluxDB up (if not duckduckgo-it). So just add an InfluxDB sender. The sender itself looks like:
"influx": {
  "type": "influx",
  "measurementfrommetadata": "measurement",
  "URL": "https://your-influx-host:andport/write?db=db",
  "Timeout": "4s"
}
The only thing interesting here is "measurementfrommetadata", which tells the influx-sender to chose which measurement to write to based on a metadata key. This is how we end up with different measurements for different sensors.
All put together:
{
  "receivers": {
      "udp": {
        "type": "udp",
        "address": ":3300",
        "handler": "protobuf"
      }
  },
  "handlers": {
    "protobuf": {
      "parser": "protobuf",
      "transformers": [
          "interfaceexp_stats",
          "interface_stats",
          "interface_info",
          "optics_diag",
          "interfaces_interface",
          "flatten",
          "remove",
          "extract_names",
          "extract_measurement_name",
          "extract_measurement_name2",
          "flatten_systemId"
      ],
      "sender": "fallback"
    }
  },
  "senders": {
     "fallback": {
        "type": "fallback",
        "next": ["influx","print"]
     },
     "print": {
        "type": "debug"
     },
     "influx": {
        "type": "influx",
        "measurementfrommetadata": "measurement",
        "URL": "https://your-influx-host:andport/write?db=db",
        "Timeout": "4s"
     }
  },
  "transformers": {
     "interfaceexp_stats": {
        "type": "split",
        "field": ["interfaceExp_stats"]
     },
     "interfaces_interface": {
        "type": "split",
        "field": ["interface"]
     },
     "interface_stats": {
        "type": "split",
        "field": ["interface_stats"]
     },
     "interface_info": {
        "type": "split",
        "field": ["interface_info"]
     },
     "optics_diag": {
        "type": "split",
        "field": ["Optics_diag"]
     },
     "flatten": {
        "type": "data",
        "flatten": [
           ["aggregation","state"],
           ["egress_queue_info"],
           ["egress_errors"],
           ["egress_stats"],
           ["ingress_errors"],
           ["ingress_stats"],
           ["egress_stats"],
           ["ingress_stats"],
           ["op_state"],
           ["optics_diag_stats"],
           ["optics_diag_stats__optics_lane_diag_stats"]
        ]
     },
     "remove": {
        "type": "data",
        "remove": [
           "aggregation",
           "egress_queue_info",
           "egress_errors",
           "egress_stats",
           "ingress_errors",
           "ingress_stats",
           "egress_stats",
           "ingress_stats",
           "op_state",
           "optics_diag_stats",
           "optics_diag_stats__optics_lane_diag_stats"
        ]
     },
     "extract_names": {
        "type": "metadata",
        "extractFromData": ["if_name", "parent_ae_name","name"]
     },
     "extract_measurement_name": {
        "type": "replace",
        "regex": "^([^:]*):/([^:]*)/:.*$",
        "source": "sensorName",
        "destination": "measurement",
        "replacement": "$2"
     },
     "extract_measurement_name2": {
        "type": "replace",
        "regex": "[^a-zA-Z]",
        "source": "measurement",
        "replacement": "_"
     },
     "flatten_systemId": {
        "type": "replace",
        "regex": "-.*$",
        "source": "systemId"
     }
  }
}
I added one last bit: The fallback sender. With that Skogul will first try the influxdb sender, if that fails, it will use the next one up: printing to stdout. So if you see lots of data on stdout, something is wrong.
Bonus: Continuous Queries for InfluxDB
If you have an extensive network, you probably want some continuous queries up. We're currently working on these, but this is a good start, and avoids a few nasty pitfalls:
name: skogul
name        query
----        -----
cq_if_stats CREATE CONTINUOUS QUERY cq_if_stats ON skogul RESAMPLE FOR 7m BEGIN SELECT mean(inoctets) AS inoctets, mean(outoctets) AS outoctets, max(*), min(*) INTO skogul.autogen.interface_rates FROM (SELECT non_negative_derivative(ingress_stats__if_octets, 1s) AS inoctets, non_negative_derivative(egress_stats__if_octets, 1s) AS outoctets FROM skogul.autogen.junos_system_linecard_interface GROUP BY systemId, if_name, parent_ae_name) GROUP BY *, time(1m) fill(linear) END
ae_rates    CREATE CONTINUOUS QUERY ae_rates ON skogul RESAMPLE FOR 7m BEGIN SELECT sum(inoctets) AS inoctets, sum(outoctets) AS outoctets, sum(max_inoctets) AS max_inoctets, sum(max_outoctets) AS max_outoctets, sum(min_inoctets) AS min_inoctets, sum(min_outoctets) AS min_outoctets INTO skogul.autogen.ae_rates FROM (SELECT mean(inoctets) AS inoctets, mean(outoctets) AS outoctets, max(max_inoctets) AS max_inoctets, max(max_outoctets) AS max_outoctets, min(min_inoctets) AS min_inoctets, min(min_outoctets) AS min_outoctets FROM skogul.autogen.interface_rates WHERE parent_ae_name =~ /ae.*/ GROUP BY systemId, if_name, parent_ae_name, time(1m) fill(linear)) GROUP BY systemId, parent_ae_name, time(1m) END
Granted, you don't really need the mean/max/min stuff if you're doing time(1m), but these CQs will work for other time periods too.
They also cover a rather annoying shortcoming if influxdb: You can't really delay a CQ. So if it's group by time(1m), then they will run ON the minute, every minute. That means data arriving at or around the exact minute might not arrive in time. We compensate for this with "resample for 7m". In addition, these queries use a _linear_ fill. But because they only ever evaluate 7 minutes of data, you will still get holes in your graphs if you do not get sensor data for more than 5-6 minutes.
I could write lots more about this, but this should get you started.
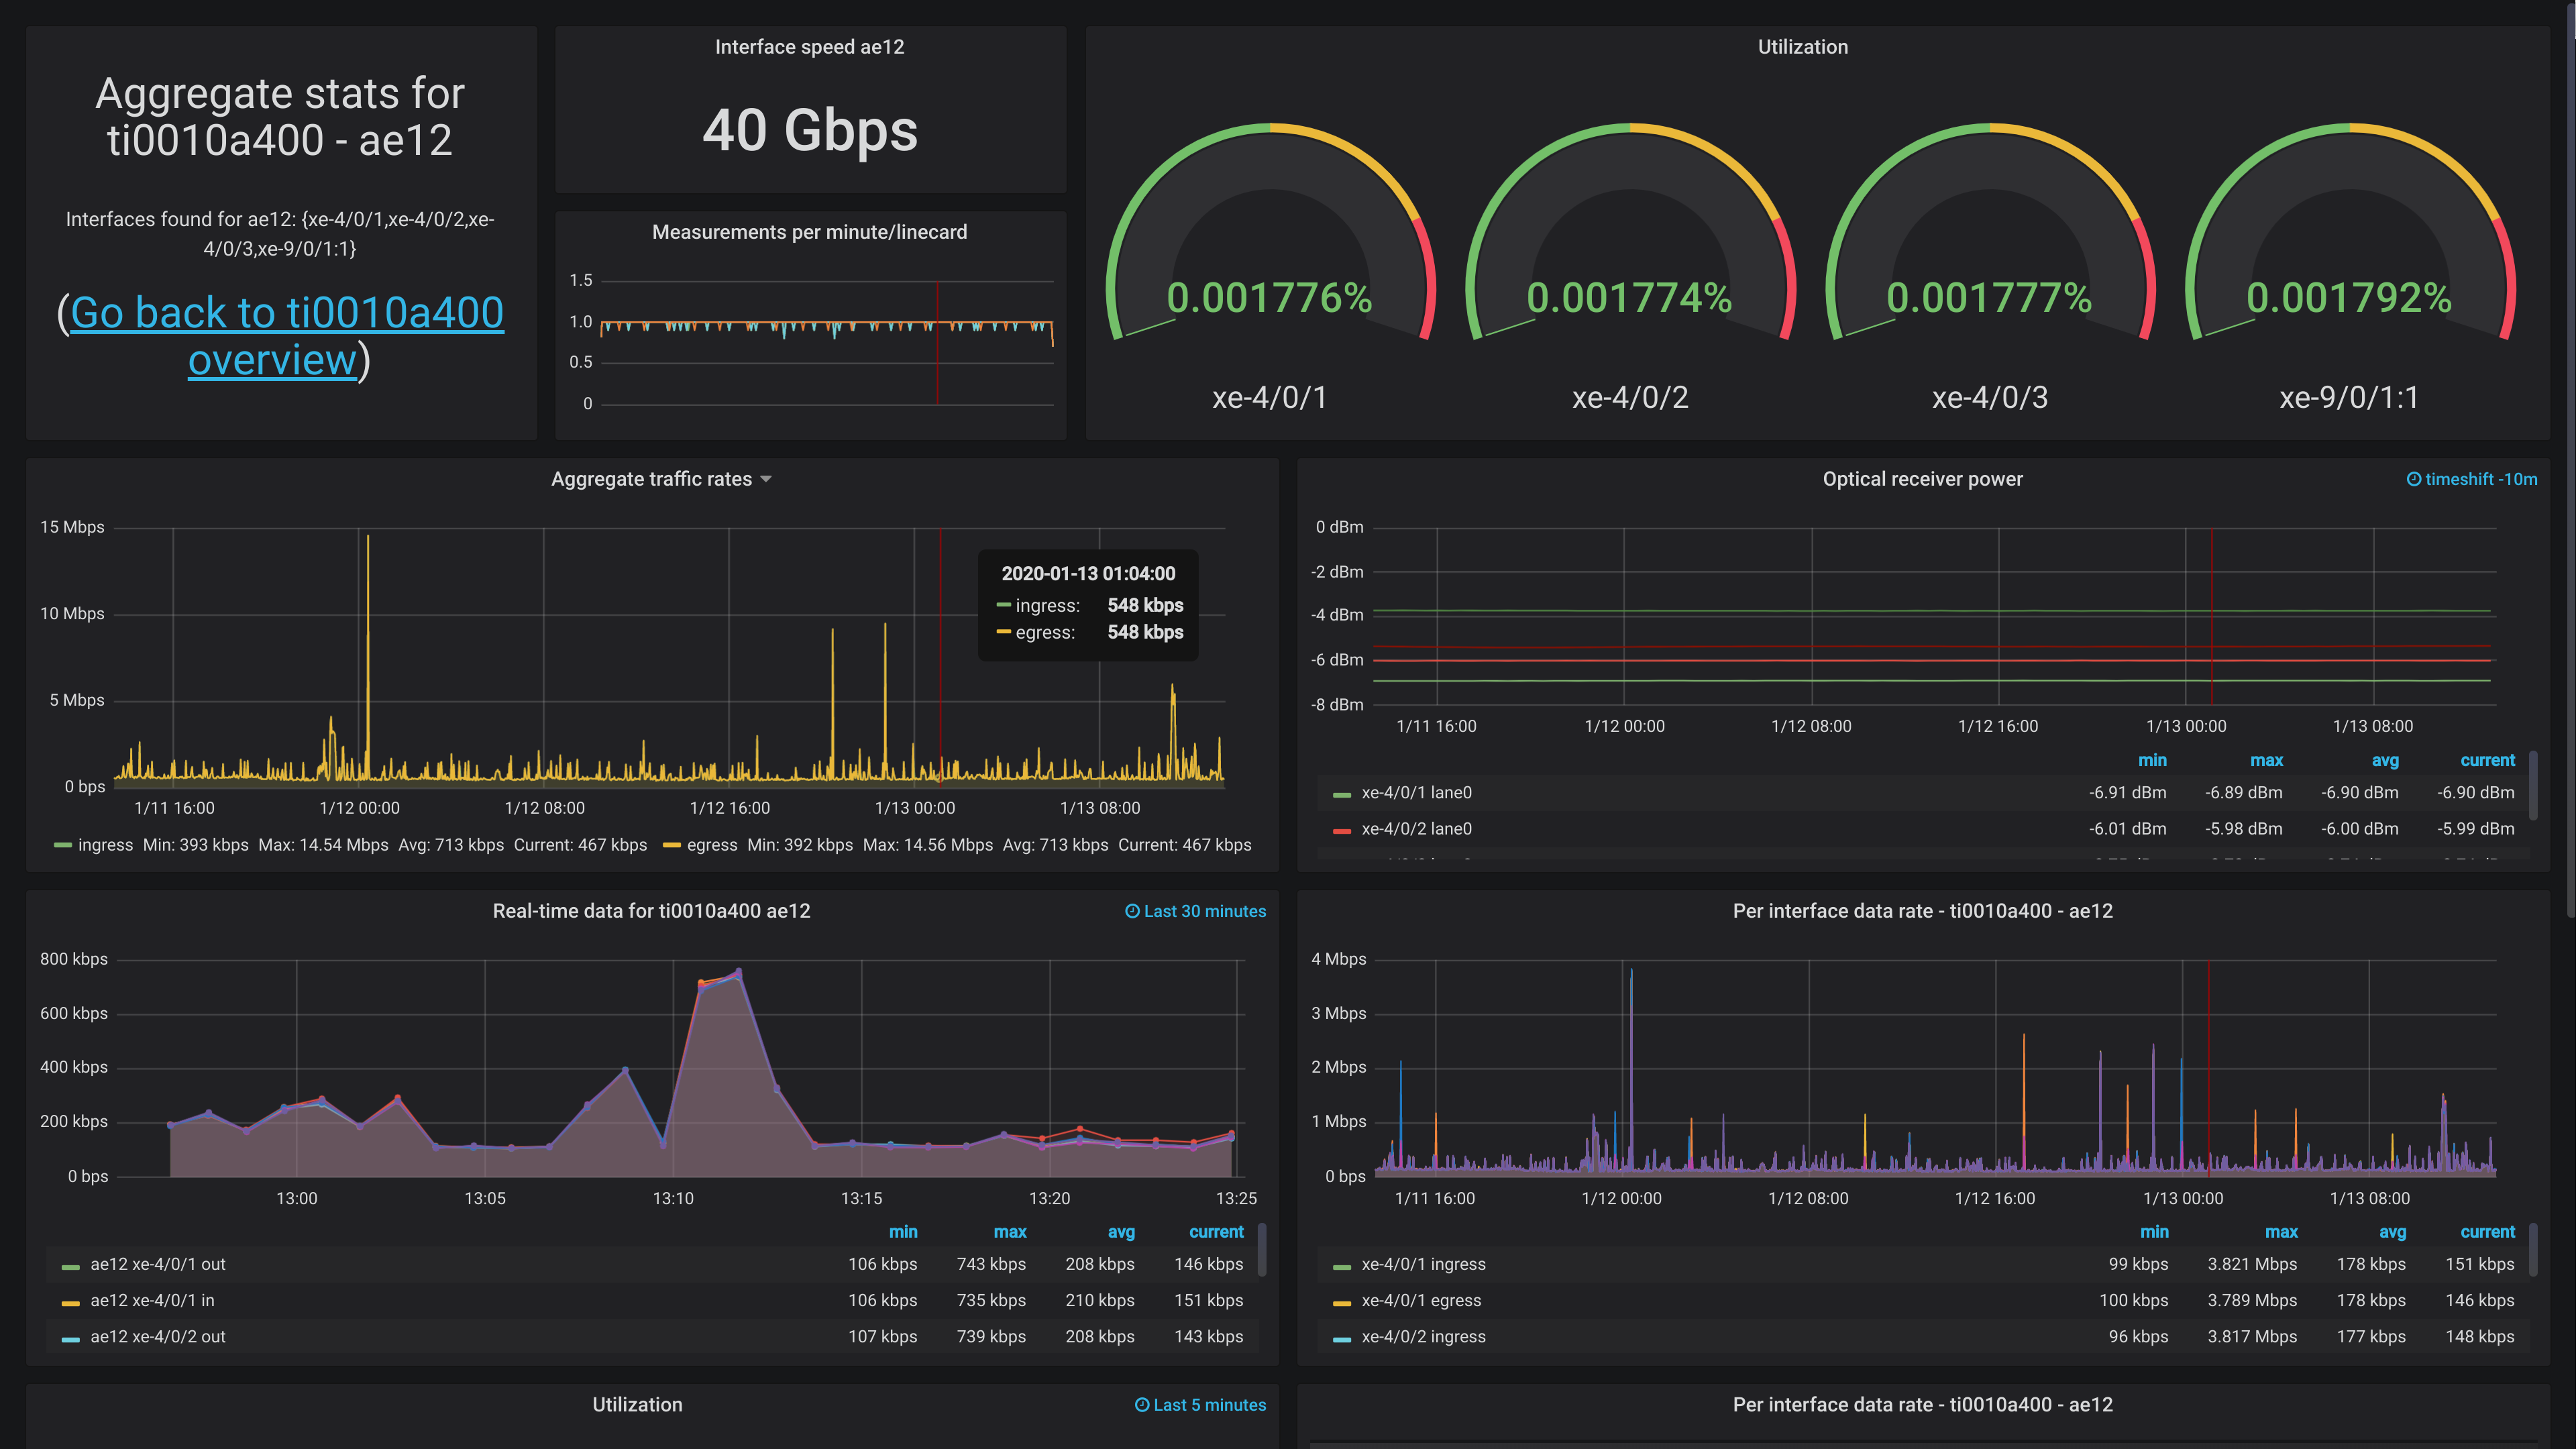
Bonus: Grafana dashboard
There's a ton of stuff you can do with this data. Unfortunately, I don't have a lot of devices I can readily show off at present - they would be showing data we can't share.
I plan on doing a more extensive write-up of how we address Grafana as a whole later, since it's a surprisingly large topic.
However, I can share a screenshot of one dashboard, showing off the aggregate uplink for The Gathering (www.gathering.org). It doesn't have any actual traffic now, since the event isn't until easter, but it should at least.
Feedback
Feel free to give feedback on twitter (http://twitter.com/KristianLyng) or wherever you can find me.