Varnishstat for dummies
Posted on 2009-12-08
Varnishstat is the tool used to monitor the basic health of Varnish. Unlike all the other tools, it doesn't read log entries, but counters that Varnish update in real-time. It can be used to determine your request rate, memory usage, thread usage, and just about anything that's not related to a specific request. As such, it's nice to know how to work with it. Below is a rough introduction.
Reading varnishstat
In it's simplest form, varnishstat is run with: «varnishstat». It will look something like this, depending on your terminal size:
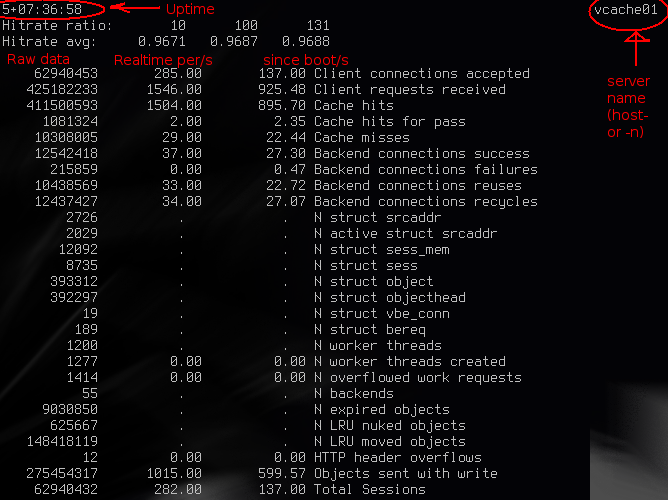
I've added the red text, in case you didn't already guess that.
The uptime here is 5 days, 7 hours, 36 minutes. The server name is the hostname by default, or what you specify with the -n argument to varnishd (and varnishstat).
While running varnishstat, you will see the three numbers right of "Hitrate ratio:" increase from 0 to 10, 100 and 1000 respectively. They are simple indicators for the numbers in the "Hitrate avg:" listing below. In the picture above, we can see that during the last 10 seconds, the hitrate average was 0.9671, during the last 100 seconds, it was 0.9687, and during the last 131 seconds, it was 0.9688. The actual numbers in hitrage average is how many cache hits you have, compared to cache misses. Keep in mind that "pass" in vcl_recv is not a cache miss, so you can have a hitrate average of 1.0, and still see backend requests. For puny mortals, you typically multiple the number with 100 and pronounce it as percentage. (Ie: 96.71%, 96.87% and 96.88%).
The rest of the output is a list of all counters. In Varnish 2.0.5 (and 2.0.4, possibly 2.0.3?), an interactive varnishstat only prints numbers that are different from zero. This is a futile attempt to display as much information as possible, as the varnishstat I have on my laptop currently has 98 counters.
The first column is the raw data of the counter. In case of cache hits, for instance, this is the total number of cache hits since Varnish was started.
The second column is the change per second in realtime. So on the image above, the server is handling 1546 requests per second. The next column is the average change per second since Varnish started. So during the past 5+ days, this server has handled 925 requests per second in average.
You will notice that some counters do not have the "per second" columns. These are counters that can decrease. Number of objects, for instance, will go both up and down, so the value of a change/second is small, since it doesn't really tell you much.
Some values to care about
(Assuming you are the caring, loving type) - Client connections accepted (per second). - Client requests received. Experience shows that a ratio close to 1:10 between connections and requests is natural on web sites. If it's far below or far above that - investigate. - Backend connections failures - Should be low, obviously. This typically results in 503-errors. Are your backends struggling? - N struct object - number of cached objects. - N worker threads - how many threads you have right now - N worker threads created - how many threads have been created (should be close to the number you are running now) - N worker threads not created - ZERO - Threads that Varnish tried to created but failed (should never happen) - N worker threads limited - reasonably low after startup - Number of threads varnish wanted to created, but wasn't able to either because of max threads or the thread_pool_add_delay. - N overflowed work requests - requests that had to be put on the request queue. should be fairly static after startup. - N dropped work requests. Requests Varnish never got to respond to because the request queue was full. Should ideally never happen. - N LRU nuked objects - Objects thrown out to make room for others. If this is zero, there's no point to make your cache larger. - esi_parse and esi_errors - ESI parsed pages and ESI pages parsed with errors, respectively. Only relevant if you use ESI. - n_expired - Objects expired (ttl reached 0 (or was set to 0) and grace too).
There are obviously more variables that might be of interest, but the list above is a good place to start and should give you a general idea of the state Varnish is in.
Other uses
- To list all stats, use «varnishstat -1». This will list everything once.
- To list just a few values: use «varnishstat -l»to find the name for the field, then «varnishtat -f field1,field2,field3»
- Use munin to graph the data into related blocks.